Researchers at the Luleå University of Technology and Scania in Sweden, recently investigated how surface topography influences oil film formation in tribological interfaces pertinent to gears. The study was oriented towards the improvement of fuel economy and sustainability. Jonny Hansen (pictured below), a member of the research team, explains how Mountains® software was used to help achieve results.

At the design stage, it is often more economically beneficial to develop a rough surface rather than a smooth one. In practice, however, a rougher surface may lead to an increase in surface distress and in expense. Hence, the challenge for gear manufacturers is to maintain adequate lubrication quality for relatively rough surfaces. In this study, MountainsMap® software was used to prove surfaces can be kept rough as long as the most prominent peaks are removed. The results highlight the importance of controlling the structure of a tribological interface for minimized friction and wear.
Tribological test sequence
A friction test, with a ball-on-disc setup, of a rough surface (0.3µm) and an opposing smooth one with nanometer roughness, was employed for tribological testing. The test conditions were set up to mimic those found in gears, i.e. lubricated steel surfaces subjected to GPa pressure and a high degree of sliding with rolling. The operating conditions were kept constant throughout the test, and were specifically selected to generate a nominal oil film thickness of 0.05µm between the point of contact of the ball and the disc.
Hence, the test began under substantial contact interference. As the test continued, surfaces were altered due to wear, and successive improvement of the lubrication quality followed – a process known as running-in. At the end of the test, the oil film had fully formed and no metallic contact persisted.
Surface re-location analysis in MountainsMap®
3D surface roughness data was acquired from the rough surface of the ball using an optical profilometer. Typically, when assessing the same area before and after a test, surface misalignment issues can be found. The following post-processing routine was therefore employed in MountainsMap®:
- The two studiables were loaded and the “Remove form” function was used.
- A Robust Gaussian filter was employed, in order to separate the roughness profile from the primary profile.
- The “Shift surface” operator was used on the series of studiables, to correct lateral and rotational misalignments (see details below).
- The “Extract area” operator was used to assess only the area subjected to wear.
Featured Results
Figure 1 (below) displays the results of the surface re-location analysis that was carried out in MountainsMap®. We can see that the most prominent peaks have been removed, but the structure of the surface topography still remains. Both of these changes contribute to improvement in lubrication quality, which ultimately allows for full film separation at the end of the test.
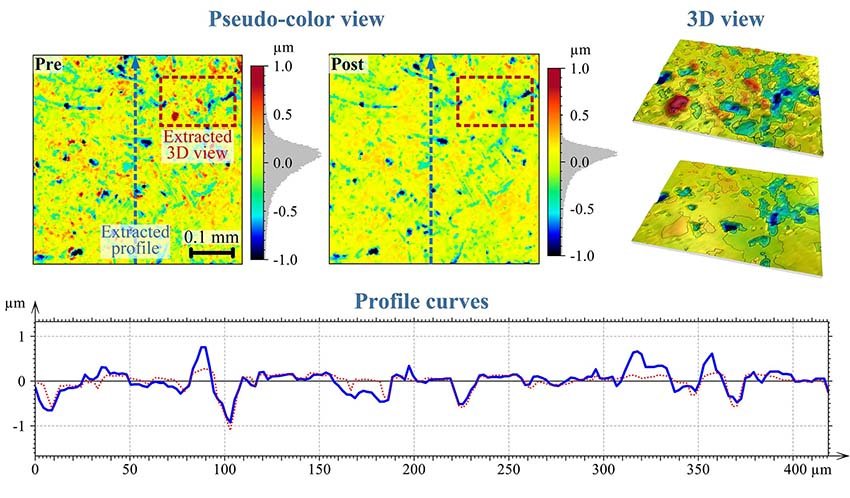
Figure 1. Surface examined before and after a running-in test. The most prominent peaks have been removed due to wear and plastic deformations.
With these results, we were able to compute the statistical data of the surface roughness. An example of the most common parameters that emerge on technical drawings are listed in figure 2 below.
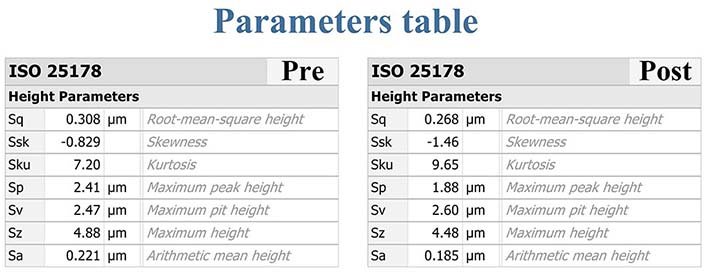
Figure 2. Typical 3D roughness parameters. The peak parameter shows significant reduction whereas the valley parameter shows a minor increase – both contribute to improved lubrication quality.
The results indicate that surface roughness peaks are especially susceptible to oil film breakdown and thus to wear and plastic deformation. When comparing the computed oil film thickness (0.05µm) to the Sq parameter obtained after the test – in accordance with standard practice – it became clear that the oil film can be over 5 times thinner than surface RMS height. This statement may seem contradictory, but it stems from the fact that rough surfaces are elastically deformed inside the area of contact. This is further discussed in our published article (see Read More).
Conclusions
By using MountainsMap® software, it was possible to study how surface roughness had to change in order for a fully separable oil film to form. It was found that the most prominent peaks were removed, while the main structure of the surface remained. These findings may aid engineers in their efforts to design durable and energy efficient tribological interfaces for rotating machinery.
Read More
Topography transformations due to running-in of rolling-sliding non-conformal contacts. Hansen, J., Björling, M., & Larsson, R. In: Tribology International, 144(106126). doi.org/10.1016/j.triboint.2019.106126
Correspondence and requests for materials should be addressed to jonny.hansen@scania.com
Instrument & software used
Optical profilometer + MountainsMap® software (Shift Surfaces operator)
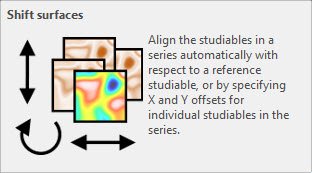
When studying surface change, it is often difficult to measure exactly the same location on a sample. The Shift Surfaces operator makes it possible to reposition one surface in relation to another. Readjustments can be done either by points of interest or automatically. Surface subtraction is then applied to quantify differences which can be visualized in cinema mode (4D view).
This operator can also be used in a template in order to stay positioned in the same coordinates frame. This is a way of carrying out profile extractions from the same place or analyzing contours.