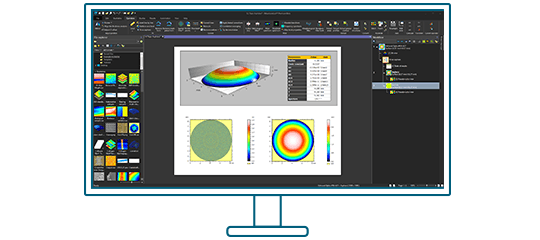
Brand-new version 9.1 is here and it comes with many exciting features: create custom styles & apply them to your studies, get improved force volume visualizations, take your force curve analyses even further with new operators & more!
Scroll down to find out more about the new features available in this release:
- Cross-technology features
- SPM/Force spectroscopy features
- Profilometry features
- Spectral features
- SEM/Spectral features
Cross-technology features
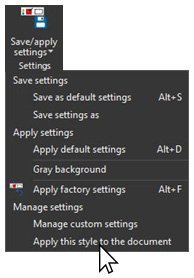
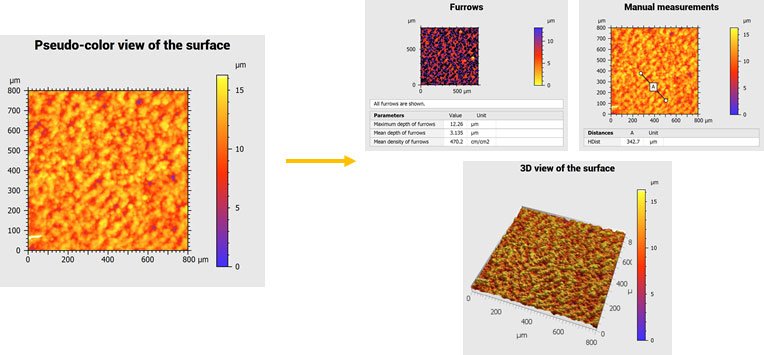
Save & apply your favorite study styles
- Create a custom style (background colors, palette, axis settings etc.) and choose to pass it on to further studies created in the document
- Quickly copy/paste styles from one study (pseudo color view, manual measurements, 3D view etc.) to another
- Choose to apply any style to all studies in the document
- The possibilities are endless!
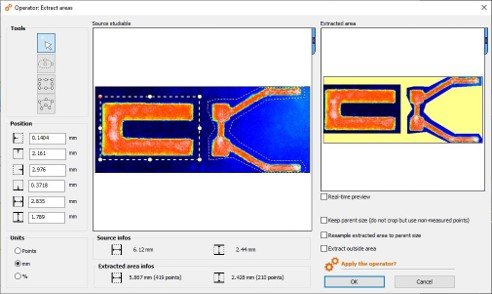
Extract multiple (custom) regions of interest
- Extract multiple areas of different shape in the Extract area operator
- Focus on the region(s) of interest the most important to you on your sample
- Rectangular, circular and custom areas can be combined and modified
- Define either areas to be extracted, or areas to be discarded from the extraction
- Extracted areas can still be manipulated directly on the studiable in the document
Even more resources to help you use Mountains®
- Updated Reference Guide
- More descriptions of features and improvements have been made available in English, German, French, and Japanese
- The Mountains® Reference Guide now totals 500+ entries
- Additional ready-to-use “templates” to help you learn
- Follow detailed explanations on how to perform analyses
- Substitute data used with your own data and get an instantly updated analysis document
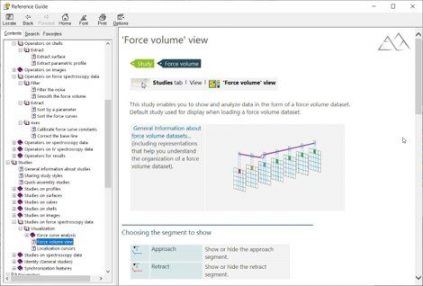
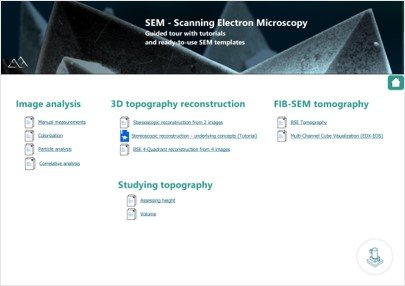
Left. The Mountains® Reference Guide now contains 500+ entries. Right. An index for each instrument technology gives access to a wide variety of resources: document “templates”, video tutorials etc.
SPM/Force spectroscopy features
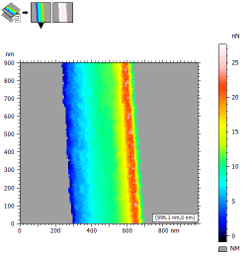
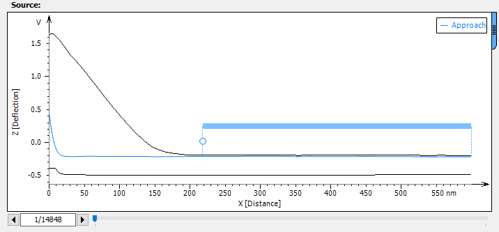
Force volume: improved visualization options
- Display approach and retract segments as thumbnails in the Force volume view study to visualize force of all points at the same distance
- Change the physical quantity (force, deflection in nm or in V) if the constants are known
- Select any point in the force volume image and visualize the corresponding curve
- Display coordinates of the curve and curve number
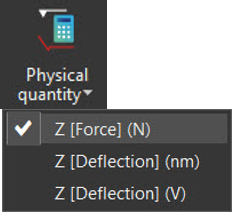
Choose physical quantity to show on Z axis
Select a point on Force Volume image and display corresponding force curve
Clean up your force curve data and get ready for analysis!
- New Sort force curves operator: remove outliers or keep curves of interest according to their shape
- Works on series of force curves and force volume datasets
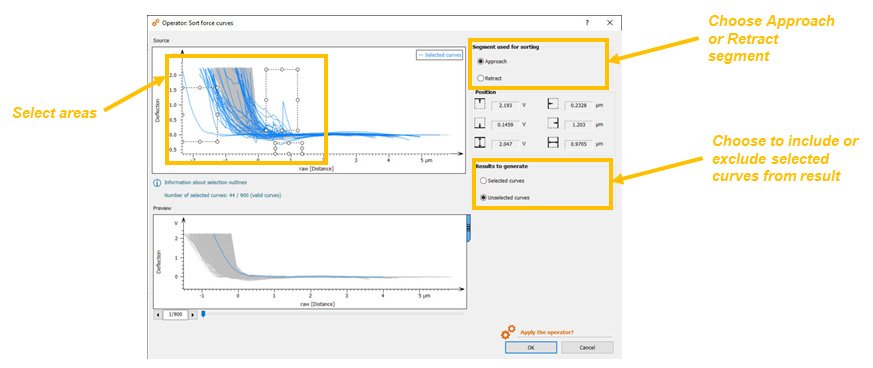
Exclude anomalies and outlying curves with the new “Sort force curves” Operator
Meaningful force curve analysis: select zones of interest
- New Sort by a parameter operator: sort force curves according to a parameter (Young’s modulus, adhesion energy etc….) for example to isolate different materials composing a sample
Selecting curves of interest using the histogram in the new “Sort by a parameter” Operator
Force curves: new features requested by users
- Calculate energy parameters and generate parameter maps (for Dissipated energy, Adhesion energy, Total deformation energy etc.)
- Fitting range: enhance indentation analysis by defining a custom fitting range on the separation axis
- Enhanced baseline detection: access new base-line detection methods in the Correct the base-line operator: Remove form and Manual. Force curve base-lines (if defined) can now be displayed as horizontal bars.
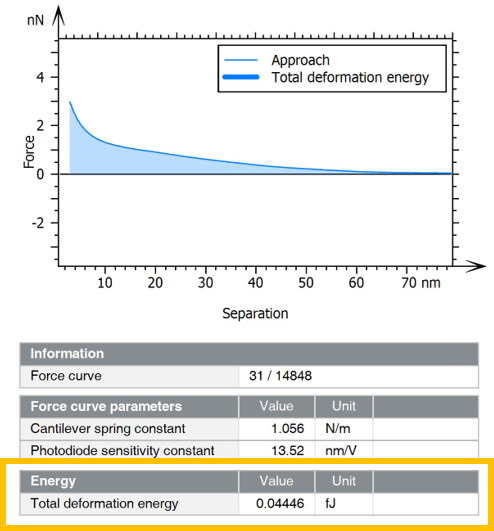
Left. Display Total deformation energy. Right. Overlay of Young’s modulus on 3D topography.
Force curves: other new features
- Manage non-measured curves in force volume datasets
- Export and import force curves in text format
- Display all force curves and envelopes in graphs
- Display axis legends on all force curve graphs
- General interface improvements for force curve and force volume data users
Left. Manage non-measured curves in force volume (here, in gray). Right. Display upper & lower envelopes (here, in black).
Profilometry features
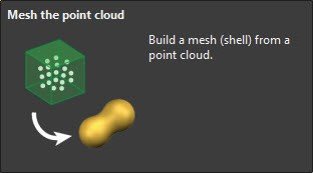
Improved point cloud meshing & shell (freeform surface) remeshing
- Mesh the point cloud operator: get a faster, more accurate result when meshing point cloud data
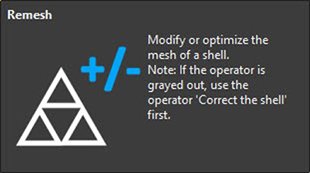
- New Remesh options on Shells:
- Homogenize triangle size using a defined edge length: a useful option when working with large datasets!
- Optimize triangles with regard to local curvature (more triangles on texturized areas and less on flat areas)
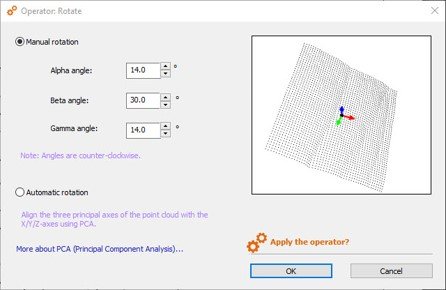
New Rotate operator on Point Clouds/Shells
- Rotate Point Cloud and Shell studiables using the new Rotate operator
- Perform rotation manually
- Specify the angles around the XYZ axes
- Or let the software automatically align the point cloud main axes to the XY horizontal plane: useful if you have a point cloud representing a flat object which has been measured at an angle
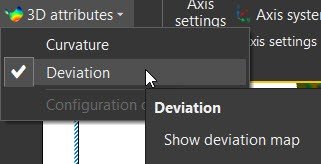
Visualize deviations used by parameters on Shells
- Generate the deviations used for the calculation of surface texture parameters on Shell and visualize them as a 3D attribute
- A useful option for visualizing the effect of the choice of reference in the “Selection of parameters” dialog
Spectral features
Load RGB images containing chemical data as multi-channel studiables
- Generate a multi-channel image when opening chemical images in standard image formats
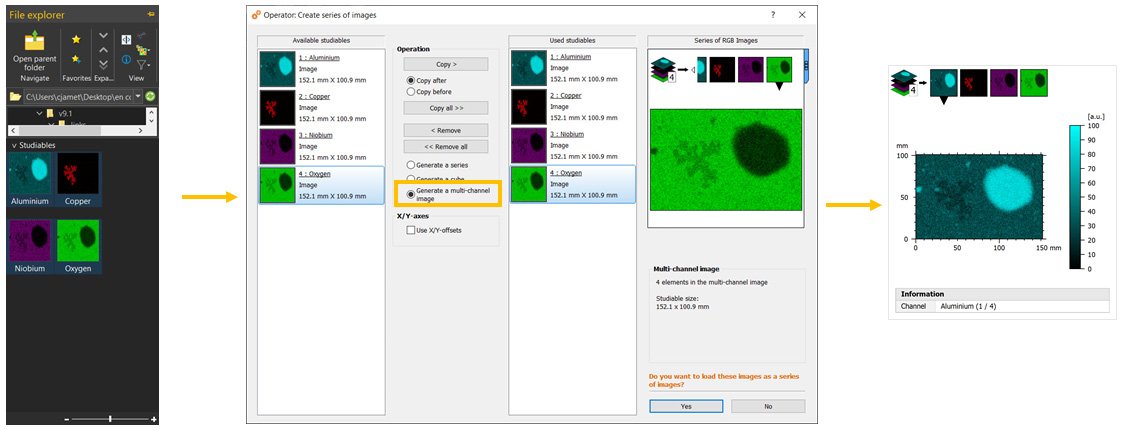
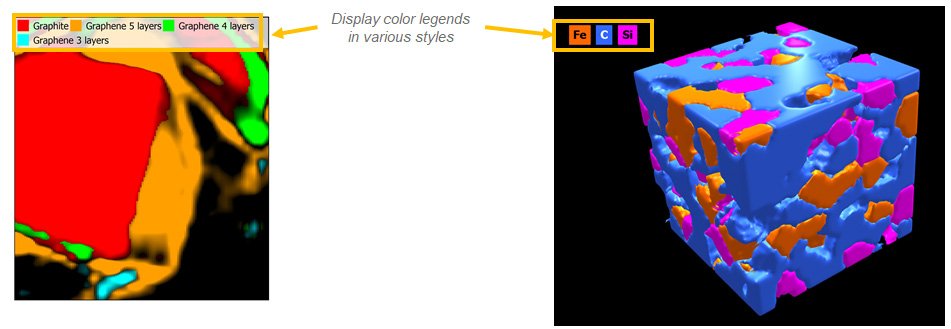
Multi-channel data: manage colors & legends
- Attribute colors & names to multi-channel cubes and images
- Dependent studies are automatically updated
- Display legends in short or long form
SEM/Spectral features
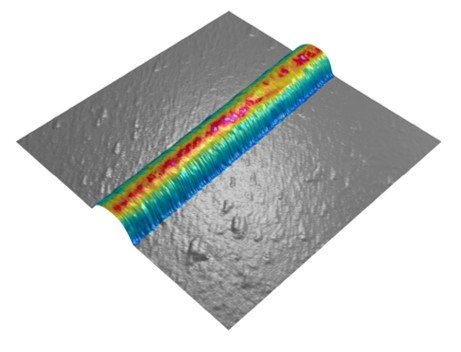
Build spectacular 3D EDS/EDX Maps
- See your SEM data like never before:
- Quickly build a 3D model from 2 successive scans or 4 4-quadrant images
- Overlay EDS/EDX Maps and choose how to display colors (mixed/unmixed)
- Reveal correlations between topography & chemical composition
- Use a single software package for this entire analysis sequence
3D model of surface topography + chemical composition
Courtesy of Emmanuel Guilmeau, CRISMAT (Caen), Jean-Claude Ménard, JEOL France
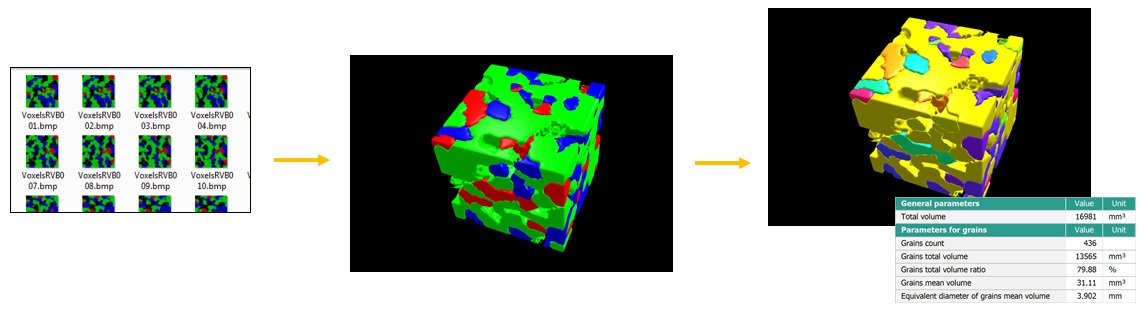
Load FIB image series as cubes & segment
- Easily load a series of images as slices of a FIB-SEM tomography cube and assemble:
- grayscale images into a single-channel BSE cube
- color images into a multi-channel cube (RGB colors interpreted as up to 3 EDX channels)
- Resample if necessary
- Use new color options and settings to visualize 3D particle segmentation (by material, by grain)
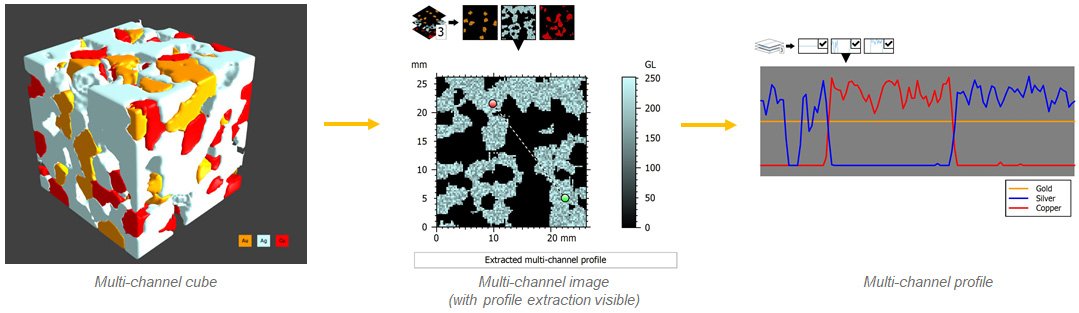
Cubes ⇒ images ⇒ profiles: from 3D to 2D to 1D chemical maps
- Switch dimensions quickly & easily to extract relevant data from your sample!
- Use Extract Slice tool to extract one of the voxel layers (2D) from a multi-channel cube (3D)
- Use Extract Profile to perform a cross section (1D) of the extracted layer (2D)
- Channel properties (colors, legend) are passed on from studiable to studiable during extractions
How to update
Access to this latest release is included in the Mountains® Software Maintenance Plan (SMP). Please visit our Software Updates page.
To find out more about SMP options, please contact sales@digitalsurf.revelateur.fr or visit this page.
Want to get a 30-day Free Trial?
Try Mountains® surface analysis software for free