To get 2020 off to a great start, the Mountains® development team have been concocting a significant version update which we are pleased to make available to customers as from today!
This release includes some exciting new tools designed to make your microscopy and profiler data and image analysis faster, easier and more efficient. Let’s check them out!
Take classification and statistics a whole step further
- New « Results » tab makes visualizing and organizing series of results quicker and easier
- All statistical tools instantly available and applicable (Control chart, Histogram, Scatter plot etc.)
- New statistical tools can be applied to series of results: Statistical summary and Box plot
- Particle analysis:
- Weight results to reflect area in histograms
- Manage numerical and text results (for example edge particles/interior particles)
- Classification:
- Choose to display data from one or several classes on scatter plots, histograms and box plots and use class colors in these
- Useful for performing statistical studies on a specific class or on several classes
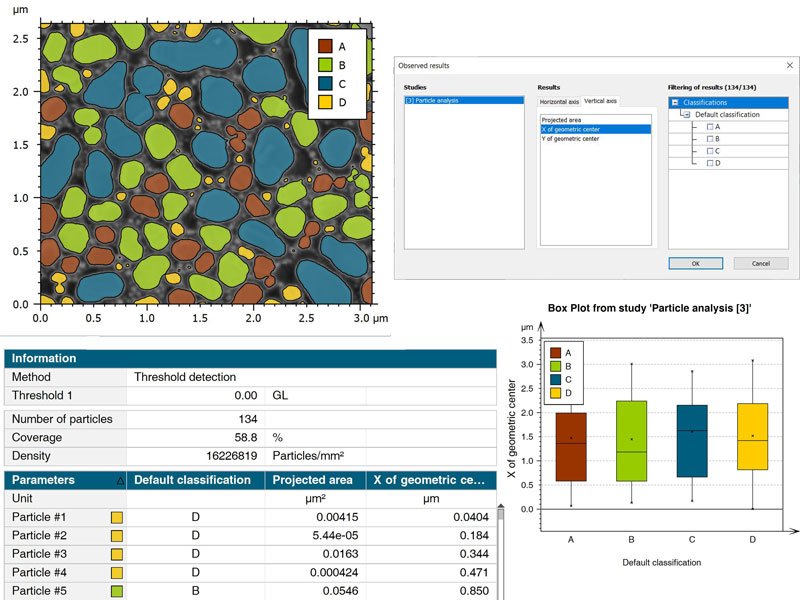
Above. Perform advanced statistical studies on selected classes
- Speed up your statistical processes by creating personalized settings and applying them at the touch of a button to batches of data
New : analyze slope distribution on surfaces
Surface directionality can have a high impact on its functionality in terms of reflectance, aspect etc.
- Calculate slope distribution on surfaces in compliance with ISO standards
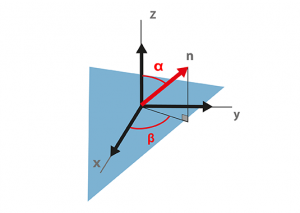
- Choose to work with slope (polar angle or α) or orientation (azimuth angle or β) values (see above)
- Create histograms and polar graphs to show slope distribution
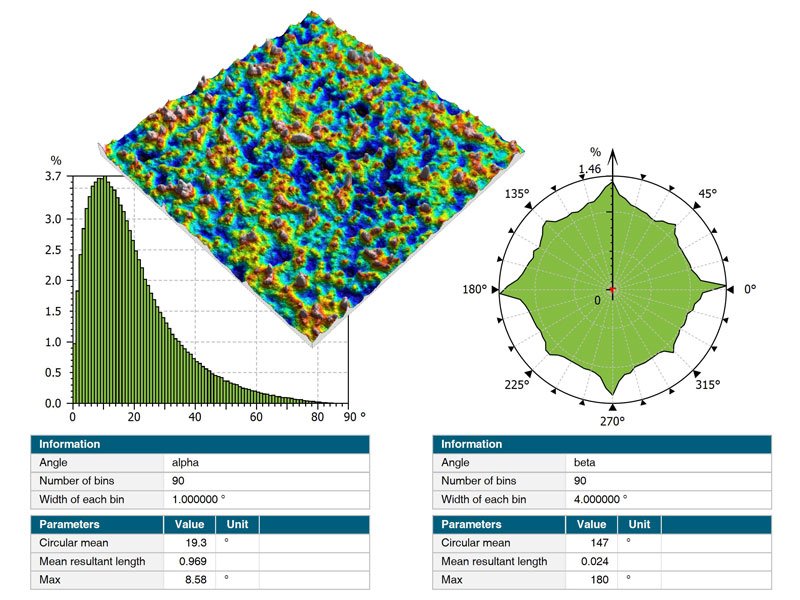
Above. Create histograms and polar graphs with the new slope distribution tool
Augmented force curve analysis
-
- You can now visualize deflection at a fixed distance
- Edit X/Y axes and choose to display time vs deflection, distance vs deflection, time vs distance etc.
- Useful for those measuring nanoindentation, quantifying stress relaxation over time etc.
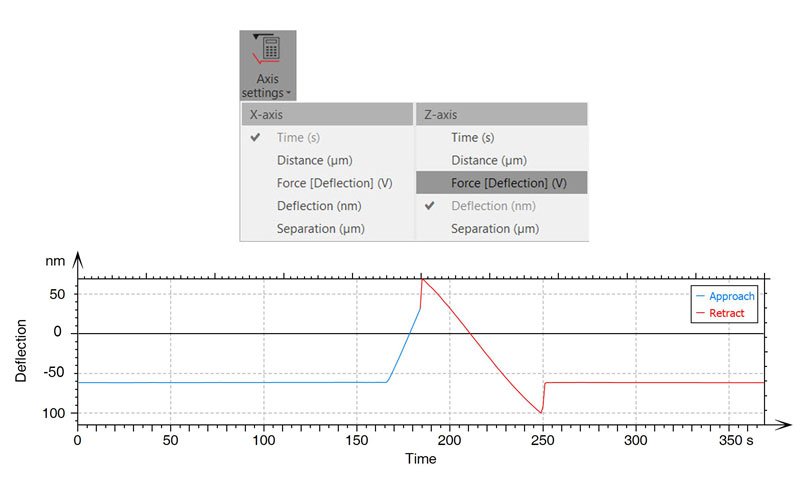
Above. New options for displaying force curves
Curve localization on images
- Choose measured force curves and spectra and display their corresponding X/Y position on images and topographies
- Synchronize SEM or AFM images with force curves and spectra when available
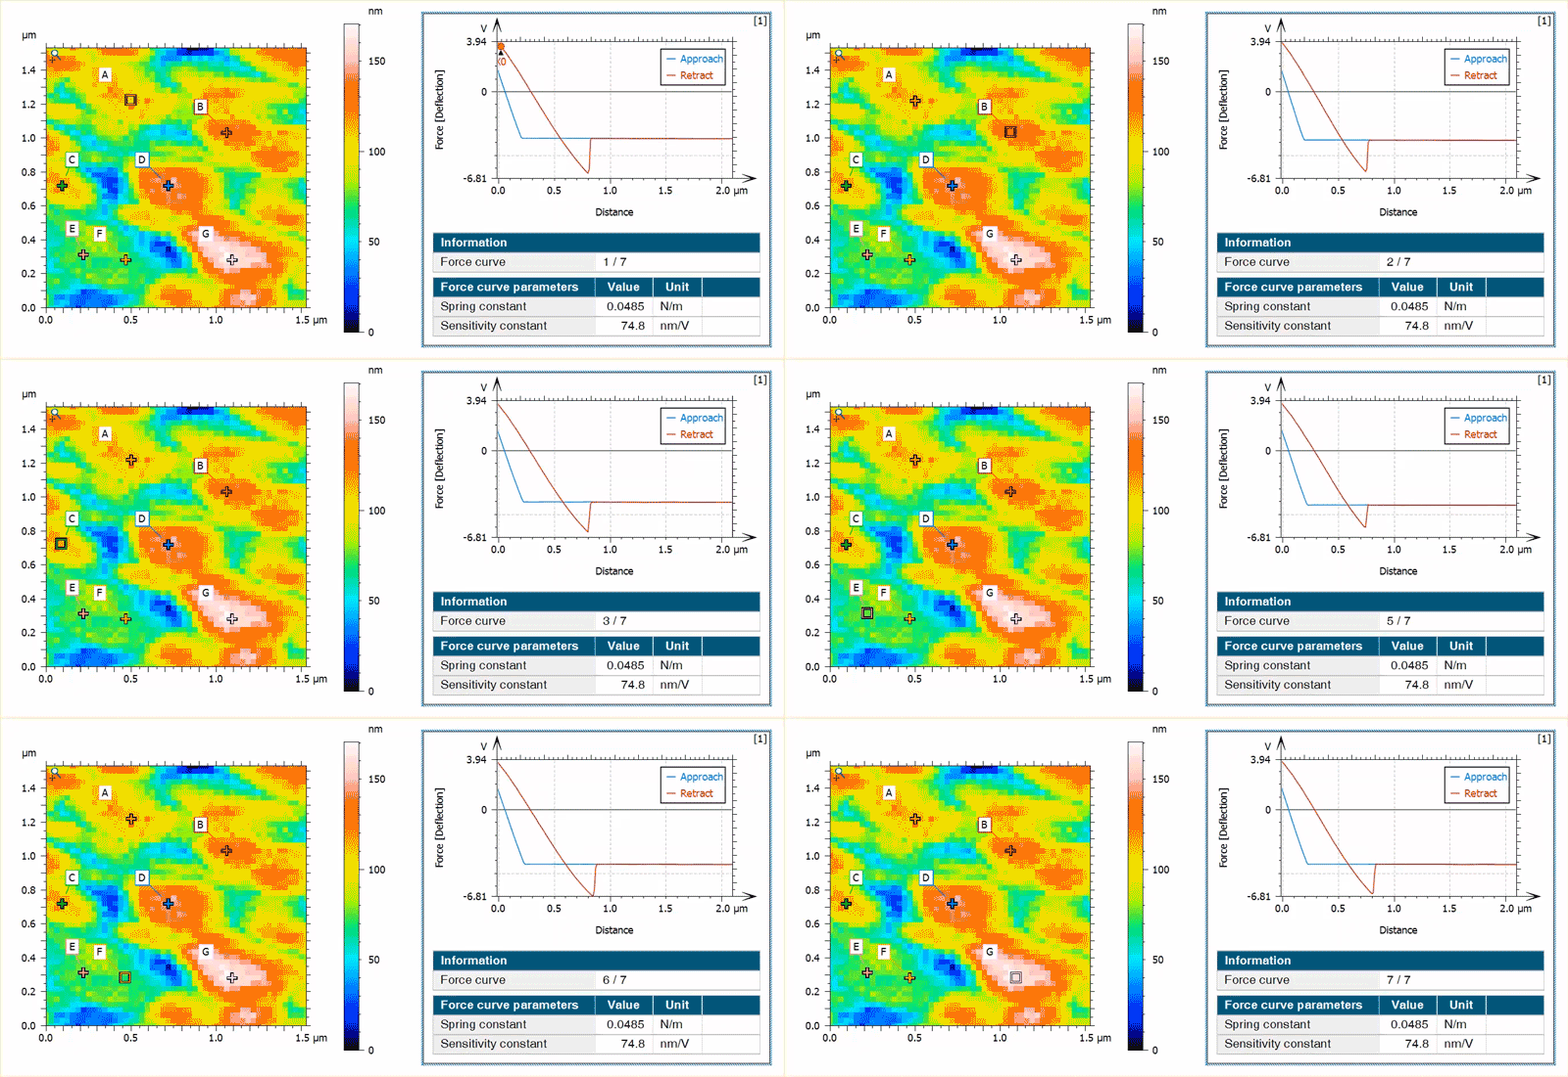
Above. Display position of individual force curves on images interactively
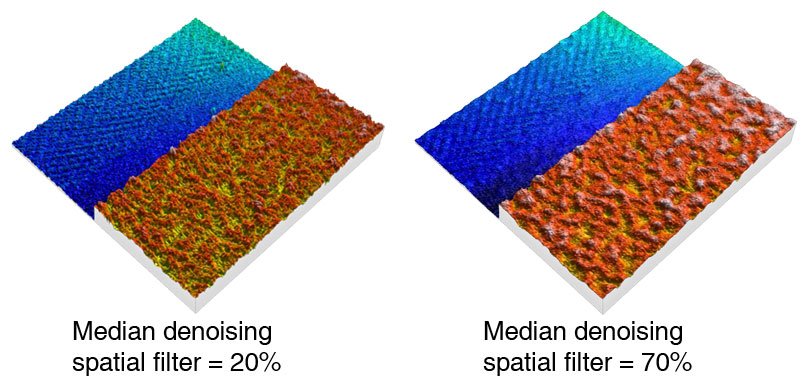
New: define Median denoising Spatial filter settings
- Remove data artefacts such as noise and spikes more efficiently without smoothing
- Define values to which you wish to apply the median filter
Depth selection enabled on Shells
- Define depth at which to extract a 3D cross section (as a surface)
- Visualize shell data “from the inside”
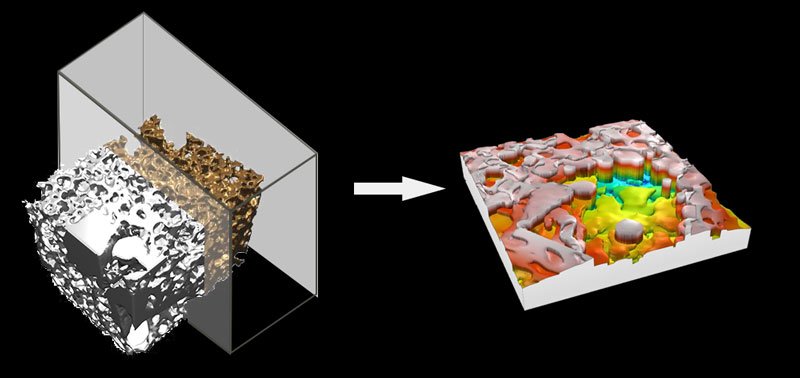
Above. Extract surfaces from different depths within shell (freeform) data
Extended options for measuring width in step height study
- Horizontal distance between centers
- Period between zero crossings
- Via new Results tab, apply statistical analysis to step height results study
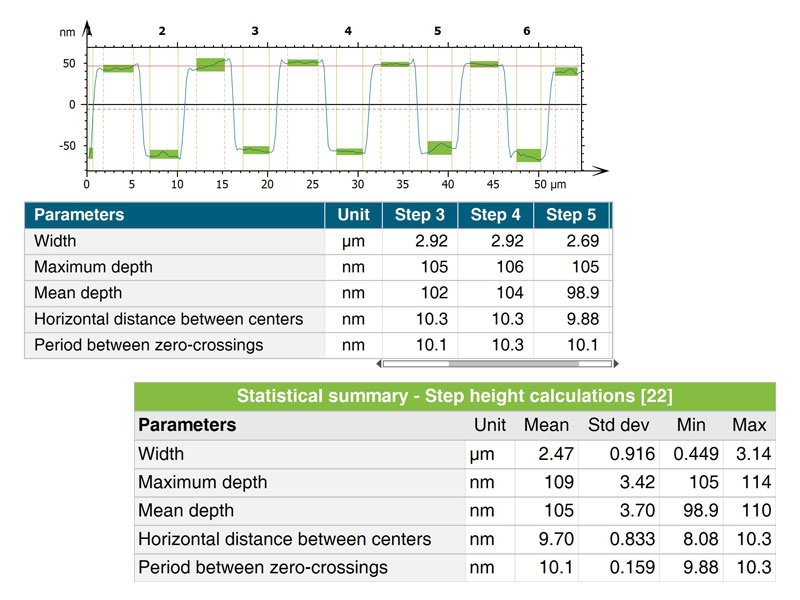
Above. Calculate new parameters on step heights and access statistical tools
Work offline
Do you use Mountains® on computers that aren’t or can’t be connected to the internet? No problem, we’ve got you covered. You can now activate and update your license offline and work whenever and wherever you please with no restrictions.
And more
For a full list of the changes and bug fixes you’ll see in this release, please visit our Software Updates page and download the release notes.