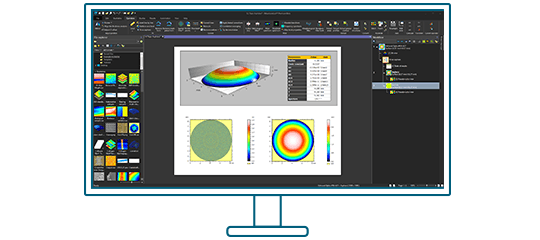
New version 9.2 of Mountains® surface analysis software is here and it comes with many exciting features! Scroll down to find out more about the new features available in this release:
- Cross-technology features
- Profilometry/Surfaces & Profiles features
- Profilometry/Shells & Point Clouds features
- Correlation & spectroscopy features
- Scanning Probe Microscopy features
Cross-technology features
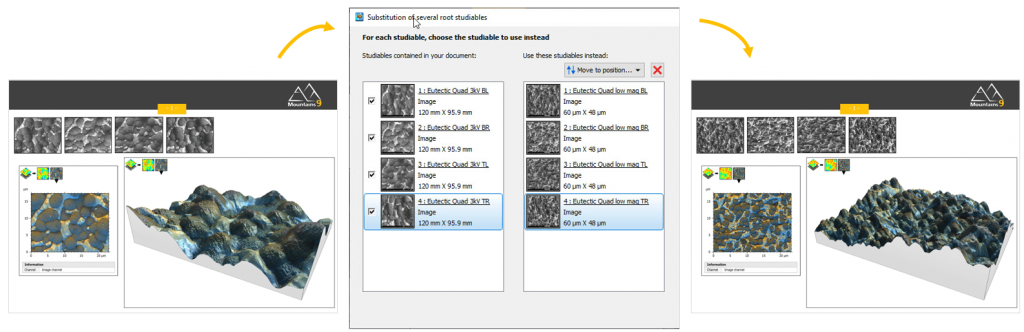
Keep your document, switch your studiables!
- Mountains® unique interactive workflow now allows you to simultaneously substitute several source studiables
- Use a document in which an operator or a study is applied on several root studiables (surface subtraction, SEM image reconstruction, colocalization etc.), or when several studiables are contained in a single file (ie. spectral images + mean spectra)
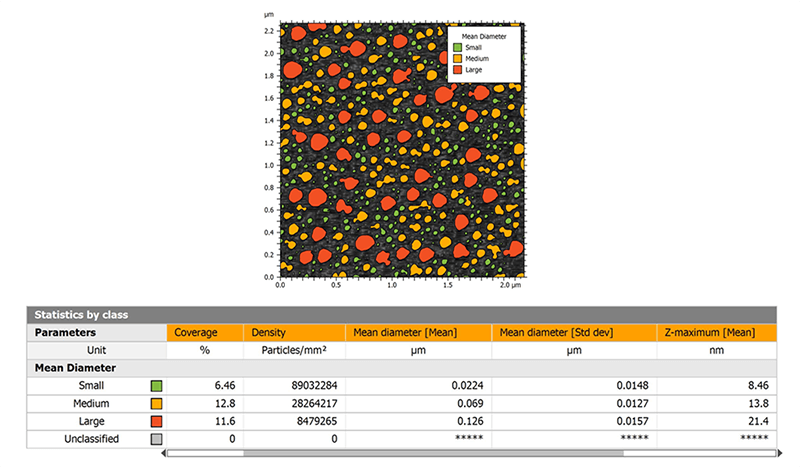
Easily access and manage statistics by class
- Display statistics by class directly in the Particle Analysis study to compare different particle populations in the same sample
- Choose which parameters and which statistics to show
- Compare values from different particle classes using statistical parameters (average, standard deviation etc.)
- Parameters table is interactive => click on a class or sub-class to display its colors and legends in the particle visualization, choose to delete particles of one or several classes
- Compositional analysis: obtain coverage for each class (element)
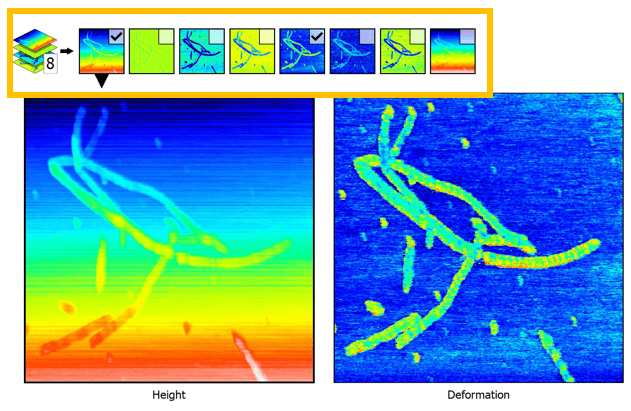
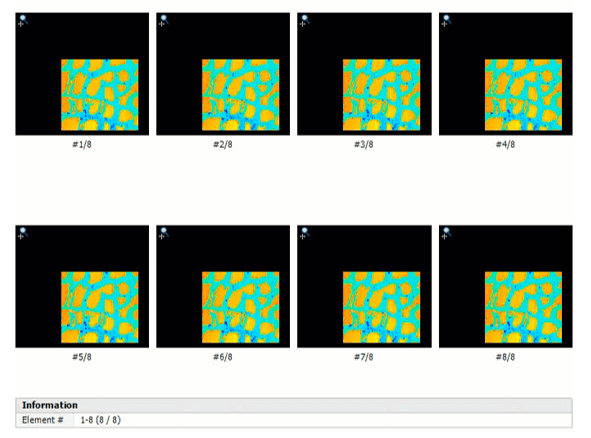
Improved Grid view
- When working with multi-channel files (series, AFM datasets etc.), choose the channels you want to show using the checkboxes
- Synchronized zoom feature allows you to dynamically visualize the same region of interest at the same time on each channel
- Get more information and a better visualization of your multi-channel data: manage axes, show graphical scale, color-scale for Z-axis etc.
Profilometry/Surfaces & Profiles features
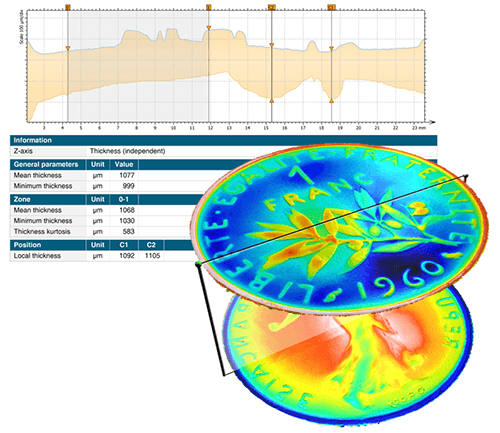
A new toolbox for analyzing thickness
- Align any two studiables to create a “thickness pair” using manual or semi-automatic tools
- Analyze thickness (between an upper layer and a lower layer)
- Generate global thickness parameters (mean thickness, minimum/maximum, standard deviation etc.)
- Calculate parameters at a specific point, along a line or over a zone
- Define maximum and minimum thickness limits and easily identify zones that are out-of-limits (useful for applications where constancy of thickness is important: varnish, coatings, sealing membranes etc.)
- Generate stunning 3D thickness visualizations
- Cross-section them to get two-profile 2D analyses of membranes with interactive measurement
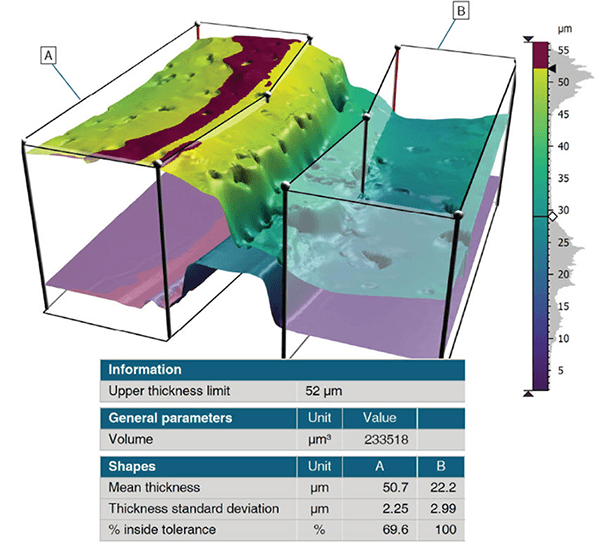
Visualize & analyze wear & deposit
- Quantify wear and material deposit
- Evaluate surface change over time by comparing two successive topography measurements of the same zone
- Generate global parameters (projected area, volume etc.)
- Calculate parameters at a specific point, along a line or over a zone
- Define maximum and minimum limits and graphically visualize zones that are out-of-tolerance
- Generate stunning 3D views of wear and deposit and animate them
- Cross-section them to get two-profile 2D analyses with interactive measurement
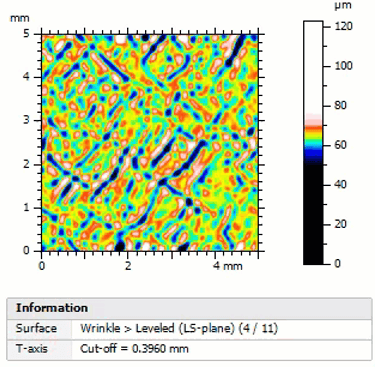
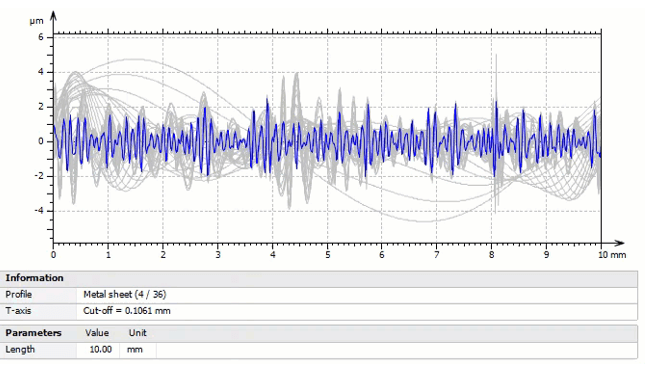
New Bandpass-filter bank operator
- Apply multiple bandpass filters with increasing cut-offs on Profiles and Surfaces
- Characterize samples at different wavelengths and correlate with surface function
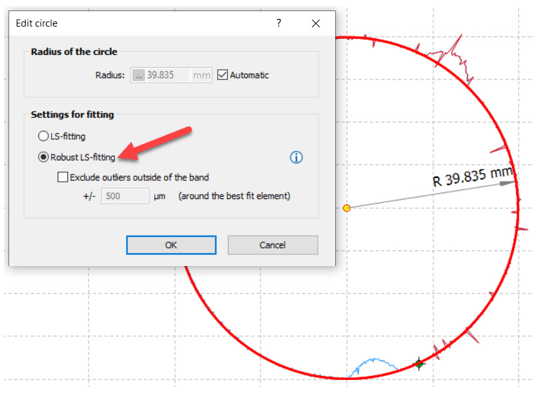
New tools for Contour Analysis
- Exclude defects on components from calculations on Contour Profiles using new robust fitting method
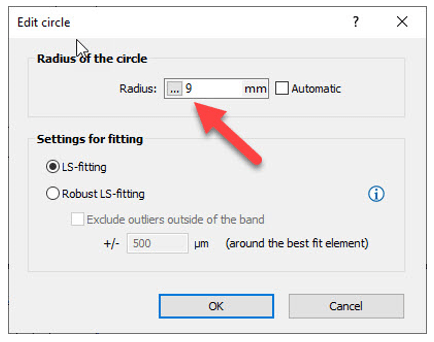
- Fit a circle with a fixed radius value when comparing with nominal form
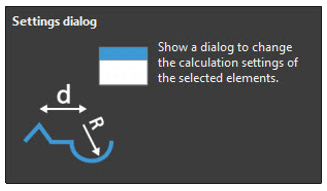
- New Settings dialog button improves usability
Profilometry/Shells & Point Clouds features
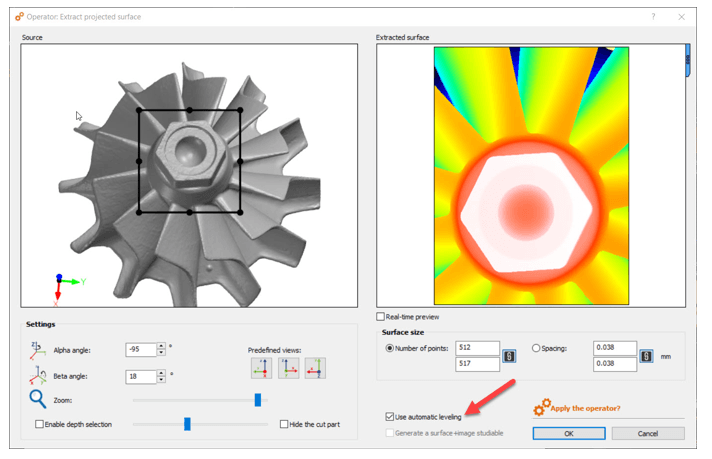
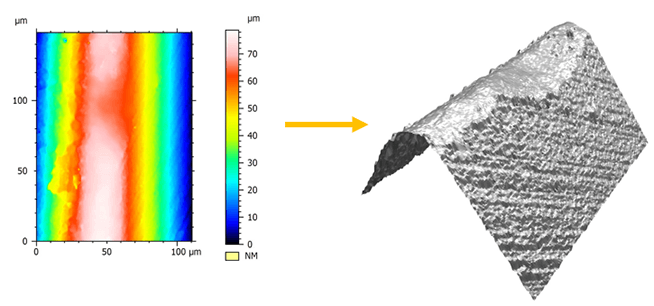
Automatically level Surfaces extracted from Shells or Point Clouds
- Save time by letting Mountains® apply best-fit leveling to surfaces extracted from Shells or Point Clouds
- Useful for analyzing roughness on hard-to-reach parts (for example on an additive manufactured part imaged using tomography)
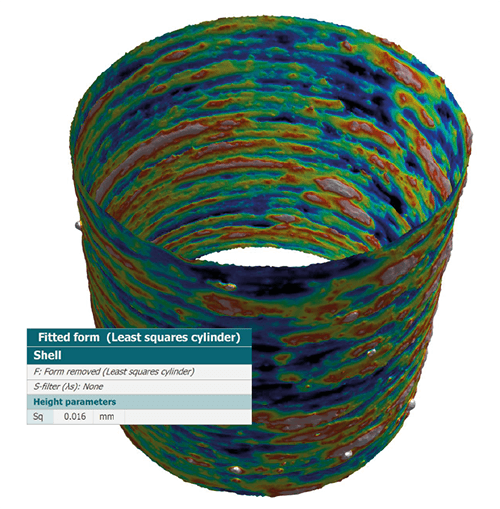
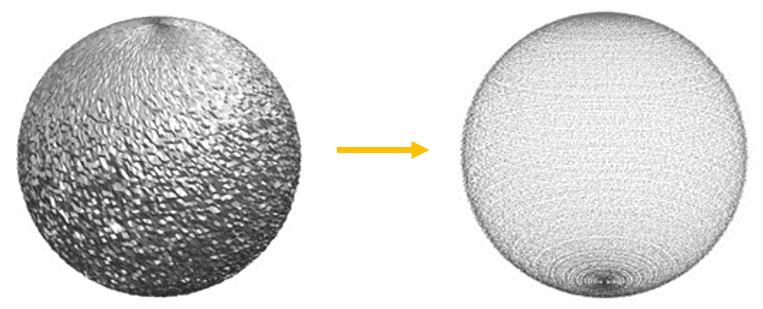
New Fit form operator
- Fit a geometric form (plane, cylinder, sphere) on a Shell using Least squares method
- Visualize the resulting Shell with a color scale indicating form deviations
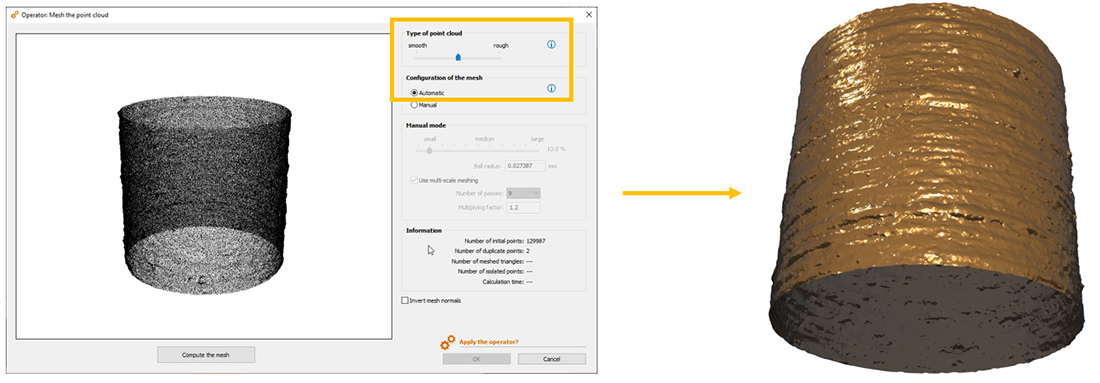
Mesh point clouds quickly with new automatic mode
- Faster meshing of point clouds with higher quality results
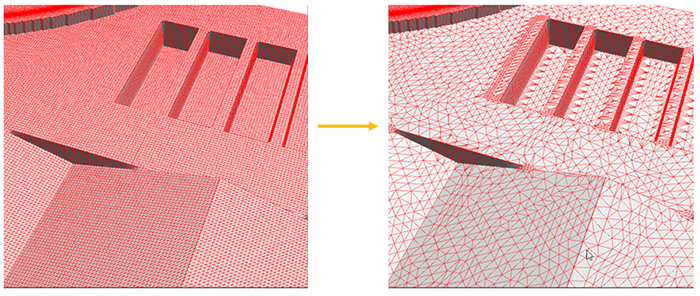
More options for remeshing and optimizing Shells
- Improved mesh optimization eliminates unnecessary points on flat zones, thus lightening file size and subsequently allowing quicker calculation times
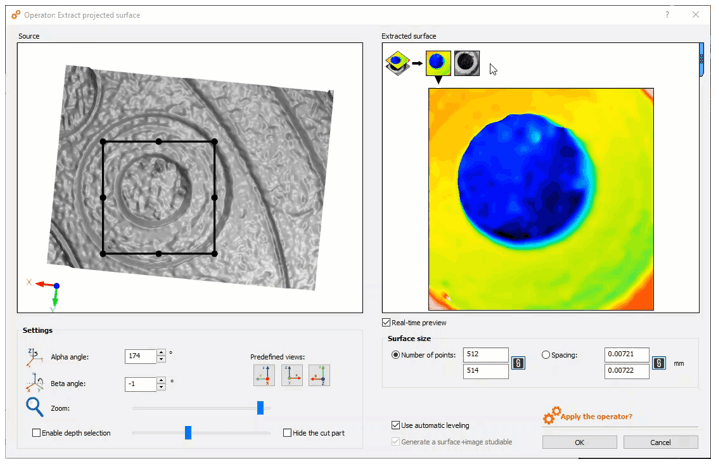
Generate a Surface+Image studiable from a Shell containing color information
- New option in Extract surface operator
- Allows even better rendering and subsequent access to image analysis tools
Better fluidity between Shells & other studiable types
- Convert surfaces to Shells and access Shell analysis features (ie. curvature calculation)
- Convert Shells to Point Clouds
Correlation & spectroscopy features
Colocalization: improved automation & new tools for correlative studies
- Thumbnails allow better identification and selection of different elements
- See overlays even if they are positioned outside the colocalization background
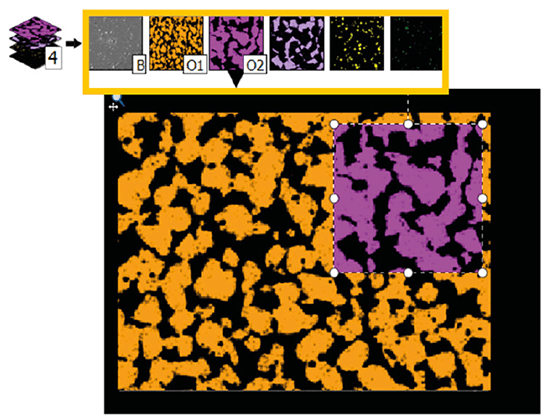
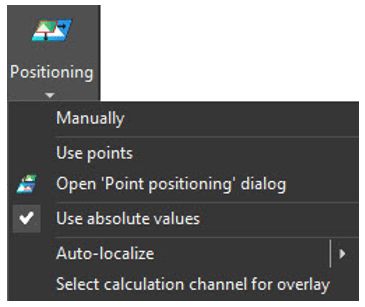
- New menu gives clearer access to positioning methods
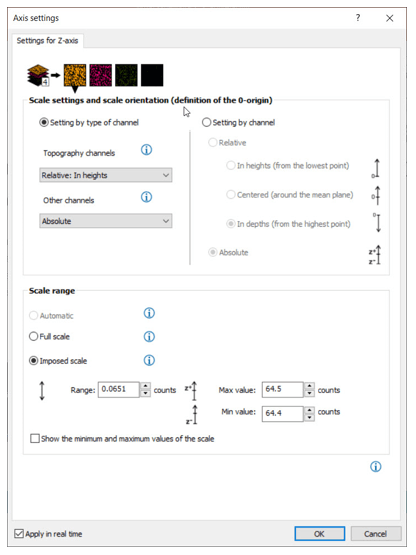
- Access axis settings when performing colocalization:
- choose absolute or relative X/Y coordinates to better highlight features
- access Z-axis settings in the case of topography
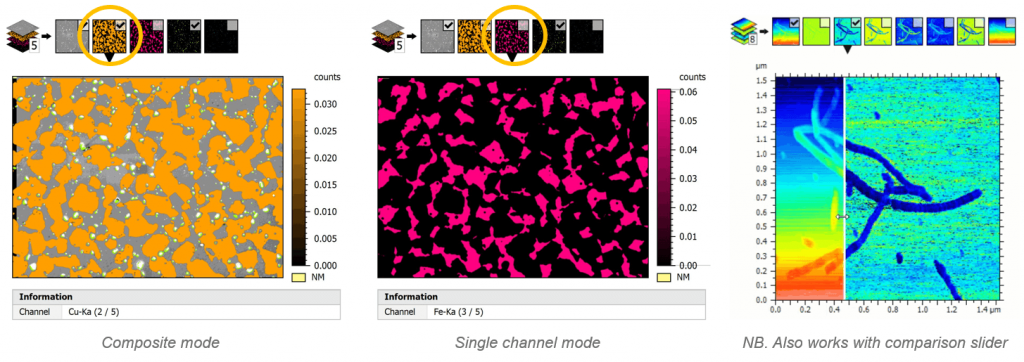
Easier navigation when working with multi-channel data
- Switch easily from composite mode (several channels) to single channel mode to visualize only parts of data which matter to you
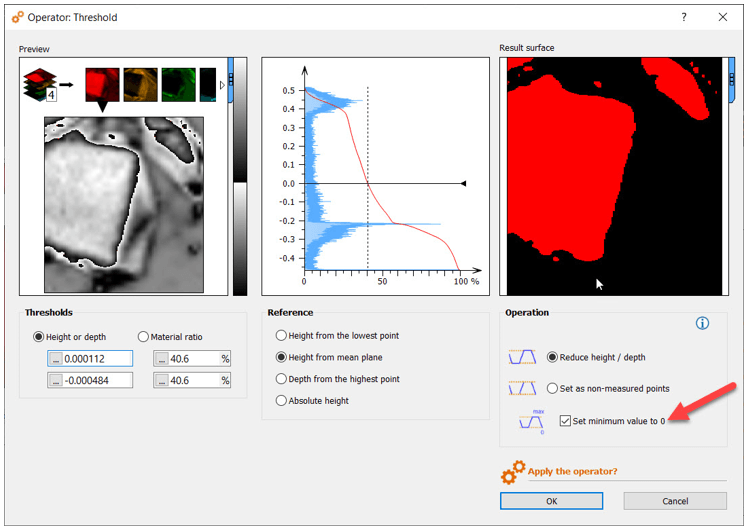
Chemical images: set minimum value to zero when thresholding
- Eliminate noise by setting baseline value to zero
- Useful for calculating spectral intensity values
Scanning Probe Microscopy features
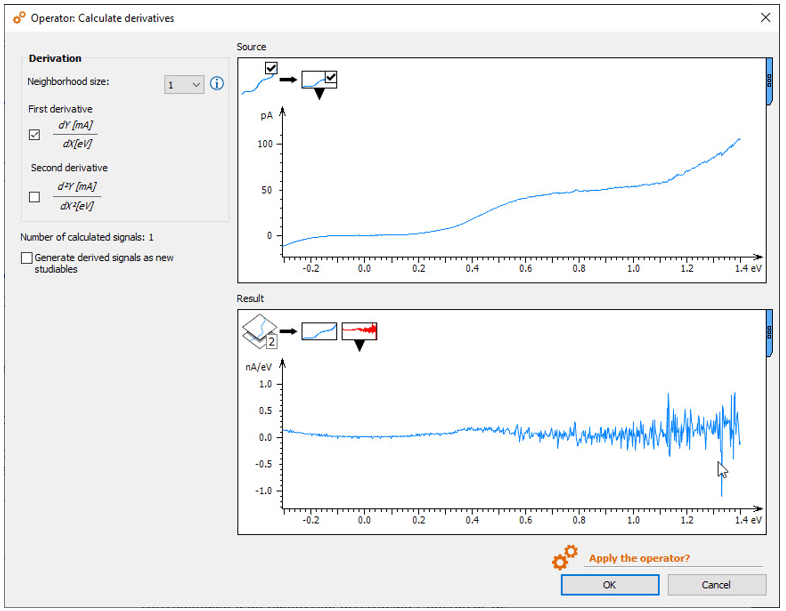
Calculate derivatives on IV curves and spectra
- Use new Calculate derivatives operator on IV curves and spectra to calculate first and second derivatives
- Quickly view the new calculated signals in the Result view
- Generated derivative signals or initial and derivative signals can be exported as studiables
- Can be used to compare measured curves with calculated mean curves
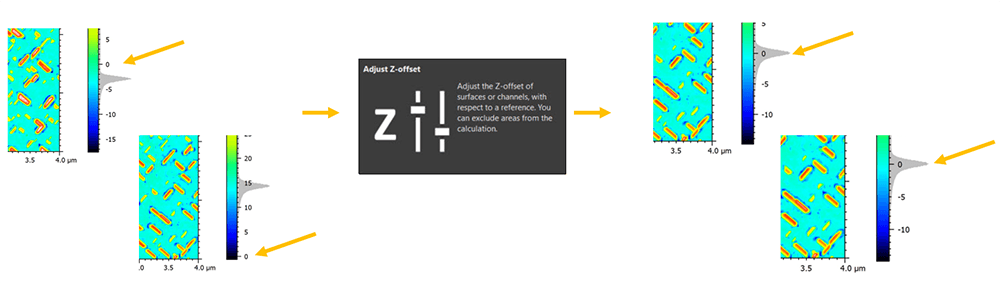
Adjust Z-offset
- Shift all absolute Z-values with a constant (set a Z-reference at a user-defined height)
- Allows users to calculate heights from a reference and improves comparisons between studies (e.g. Particle analysis)
- Developed for SPM users but can be used on data from other instrument types
How to update
Access to this latest release is included in the Mountains® Software Maintenance Plan (SMP). Please visit our Software Updates page.
To find out more about SMP options, please contact sales@digitalsurf.revelateur.fr or visit this page.
Want to get a 30-day Free Trial?
Try Mountains® surface analysis software for free