We are thrilled to unveil the Mountains 8.2® release, the latest version of our surface imaging, analysis and metrology software platform for:
- Profilometry
- Scanning Electron Microscopy
- Atomic Force Microscopy and Scanning Probe Microscopy
- Spectroscopy
- Labs with multiple instruments
New features available
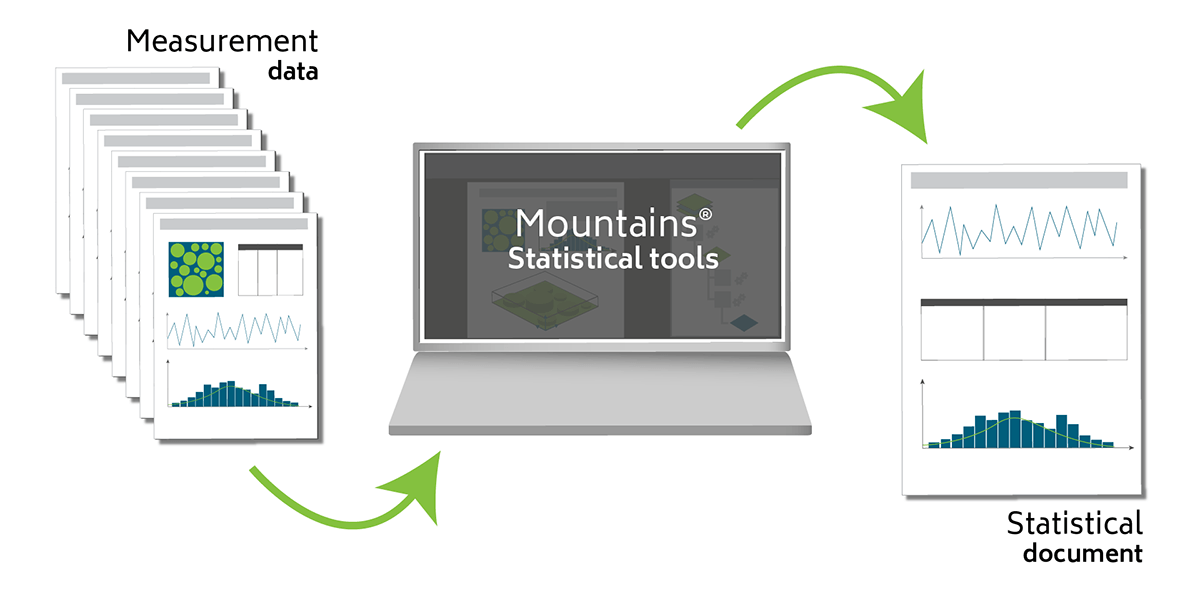
Accelerate analysis with built-in statistics tools
- No need to export results to other programs for statistical analysis!
- Powerful statistical tools for handling large quantities of measurement data and performing meaningful analysis including new features:
- for aggregating series of results in one document
- for highlighting specific information using colors
- for visualizing information in histograms
- for generating batches of statistical studies in a single click
- NB: from 8.2 onwards, most product levels include statistics tools
Many improvements for SPM users
- Force-curve analysis
- “Correct baseline” tool has been redeveloped
- Import force curves in text format
- Multilayer datasets
- Direct access to Operators and Studies on this Studiable type is now available, including FFT tools
- Multi-layer datasets: easier layer selection and visualization of topographic layers
- Greater control of axis settings including non-metric Z-axis management
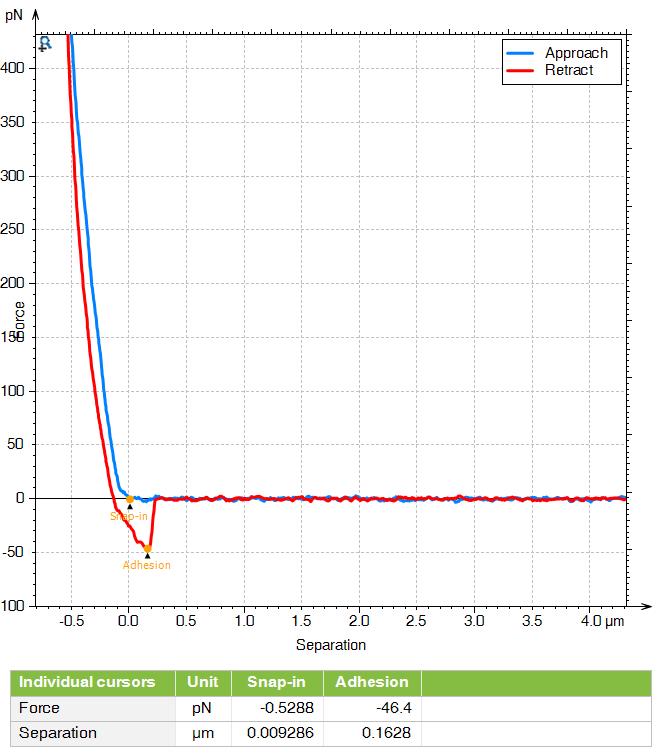
Above: Force curve analysis in a study on adhesion properties (baseline corrected with updated Mountains® 8.2 tool).
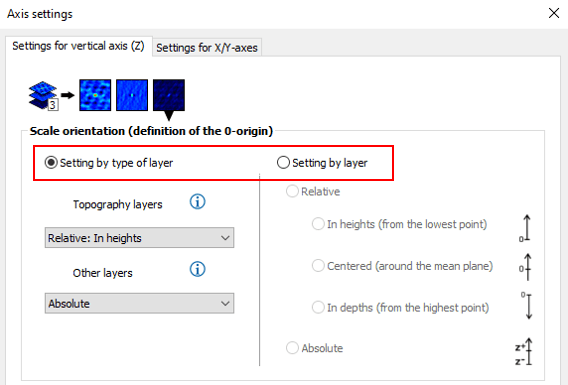
Above: New axis options for multilayer data
Easier color palette edition
- New cursor for quickly checking a number of points at the same height, for example on samples with steps or particles on a flat background
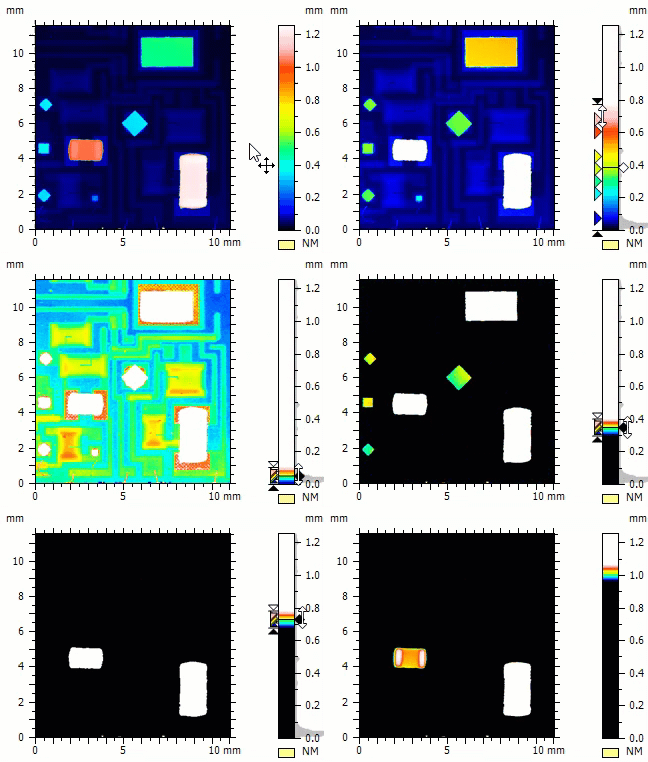
Above: Moving the rhombus cursor immediately brings to light different surface planes
The cutting-edge of metrology standards
- Access upcoming revised ISO 25178-2 parameters (official 2021) including
- New threshold definition for open/closed motifs
- Feature parameter calculations on only open/closed motifs
- New Ssw parameter: dominant spatial wavelength
- New segmentation method for R&W (profile) motifs: calculation of upper envelope
- New “Named feature parameters” and “Named shape parameters”
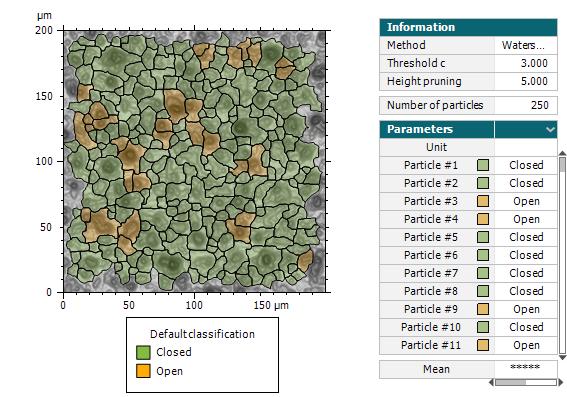
Above: Open / closed parameters in Particle Analysis Study
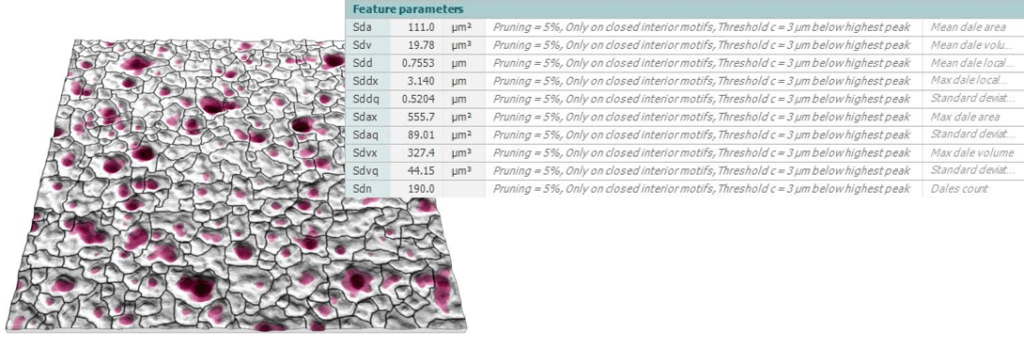
Above: Feature parameters calculated only on closed motifs
Particle analysis just keeps getting better
- New options for sorting and masking particles
- Ignore hidden and non-classified particles in tables and statistical representations
- Improved interface for particle classification
- Color bars allow better visualization of particle classification
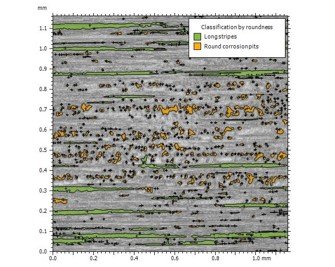
Above: Surface featuring 1) deep grooves and 2) pits caused by corrosion
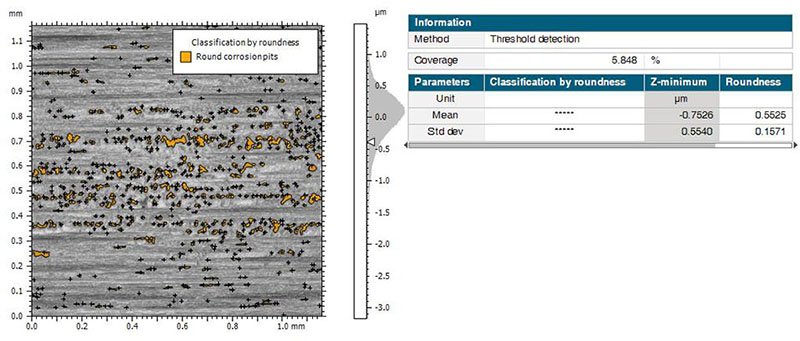
Above: Grooves (hidden) are ignored in particle analysis parameters
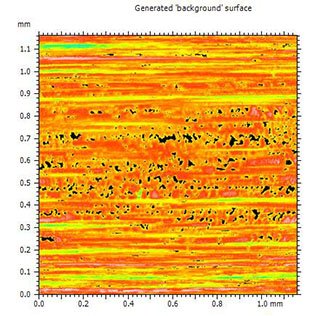
Above: Roughness parameters can be calculated on the masked surface without taking corrosion into account
Color my Mountains®
- Shell (freeform) studiables can now be loaded and displayed using the colors contained in the file itself
- Various 3D file formats are supported including the widely used PLY format.
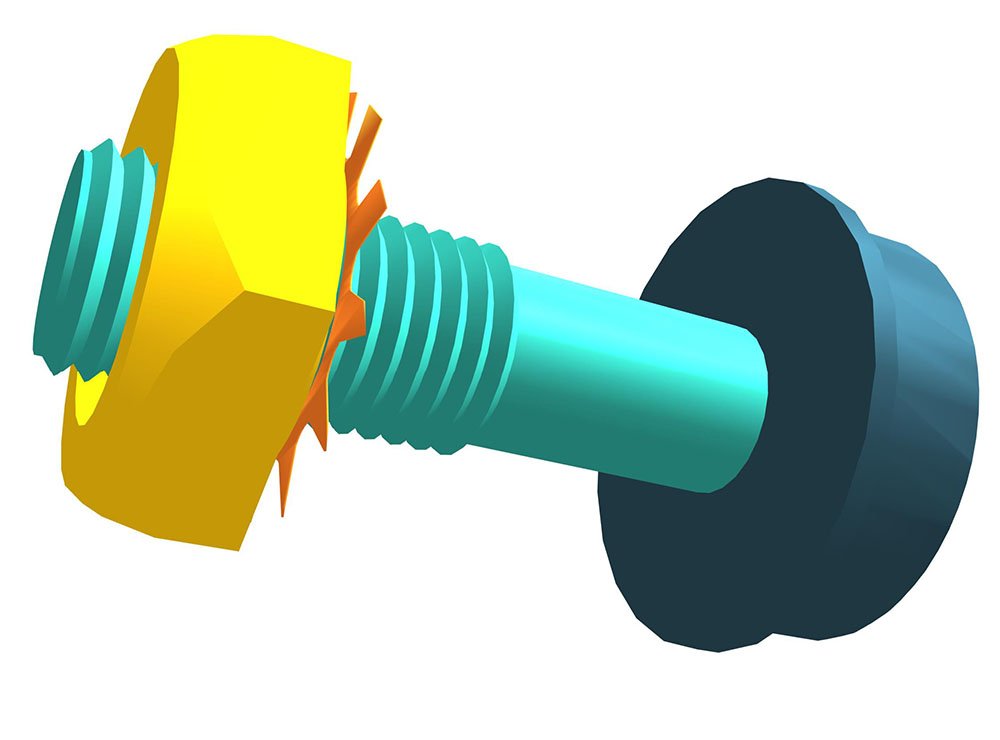
Above: Shell datasets containing color information can now be displayed
Learn Mountains®… with Mountains®
- New ready-to-use “templates” to help you learn
- For SPM users (force curves & force spectroscopy):
- Adhesion, indentation etc.
- For users of Hyperspectral Imaging techniques:
- Spectral maps: basic data processing, data visualization, multiple component visualization
- Hyperspectral cube: data visualization, data extraction, multivariate analysis (MVA)
- Correlative analysis: colocalization with optical image
- Particle analysis: edges, hills and valleys, bumps
- For SPM users (force curves & force spectroscopy):
- Access via “Home” in the Help tab
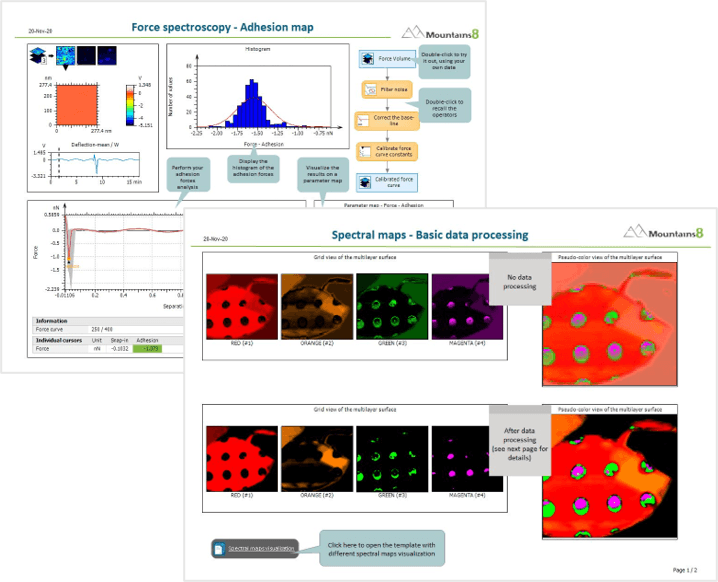
Above: Learn with our ready-to-use in app “templates” and try with your own data
Convert pseudo-color images back into surfaces
- Convert any pseudo-color (2D) image from any screen copy back into a (3D) surface
- Estimate Z-values using displayed color scale (linear color scale or discrete list of colors)
- Enter the image X/Y size or show the scale bar if there is one
- Revert to the original surface from any PDF document using a simple screen copy
- Immediate solution for unknown microscope file formats
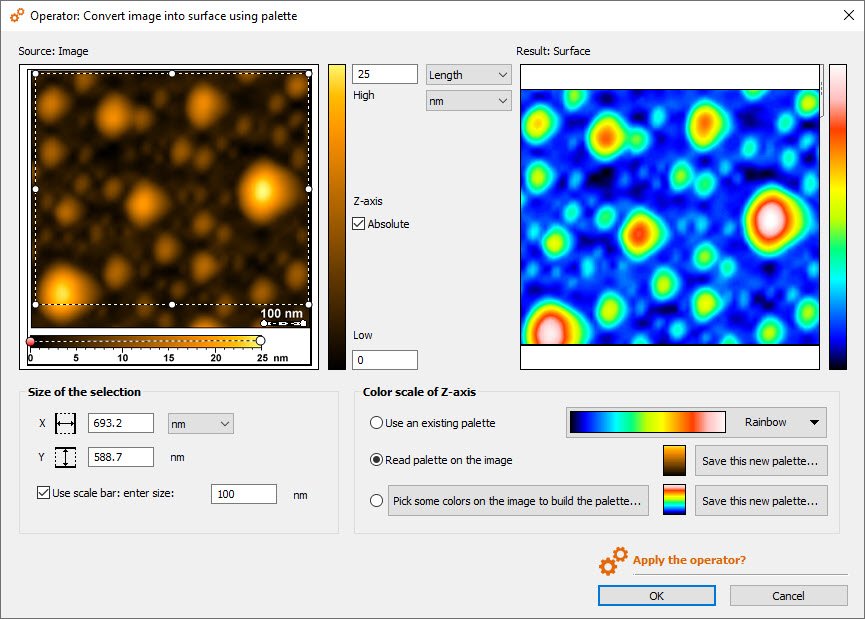
Above: New “Convert image to surface using palette” Operator
Improved tools on profiles
- Multi-layer profiles: define color for each profile to improve data visualization
- New Extract layer operator on Multi-layer profile studiables
- Resample operator on a Profile Studiable: change the number of points
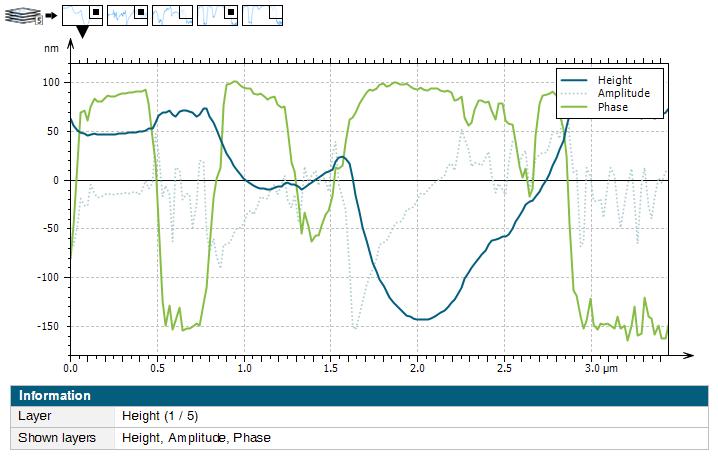
Above: Define curve colors for multi-layer profiles
New warning zone
- Warning zones can now be defined by the user to monitor results
- Detect if a value is close to a tolerance limit
- Choose how to display results in a warning one (color, text or graphic symbol)
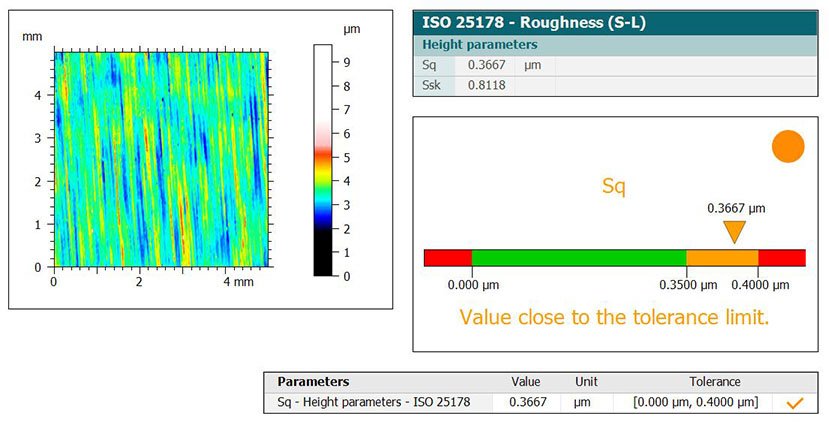
Above: Identify values close to tolerance limits
Export images or curves in Template mode
- Export studies as images when applying a template on a folder
- Export curves (histogram, Abbott curve) when applying a template on a folder
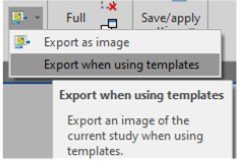
Above: Export Studies as images
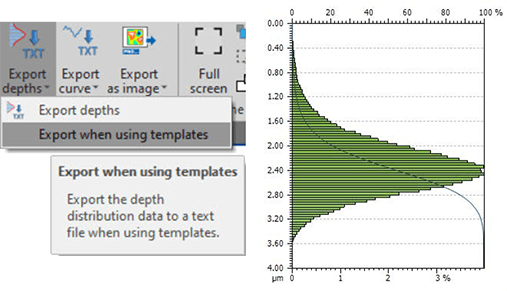
Above: Export depth distribution data
Improved automation of Colocalization
- Re-apply the Auto-localize function systematically in the Colocalization study to position the overlay
- Use the absolute X and Y coordinates to position the overlay
- Multi-layer data: choose which layer to use for auto-localize positioning (can be different from layer used for visualization)
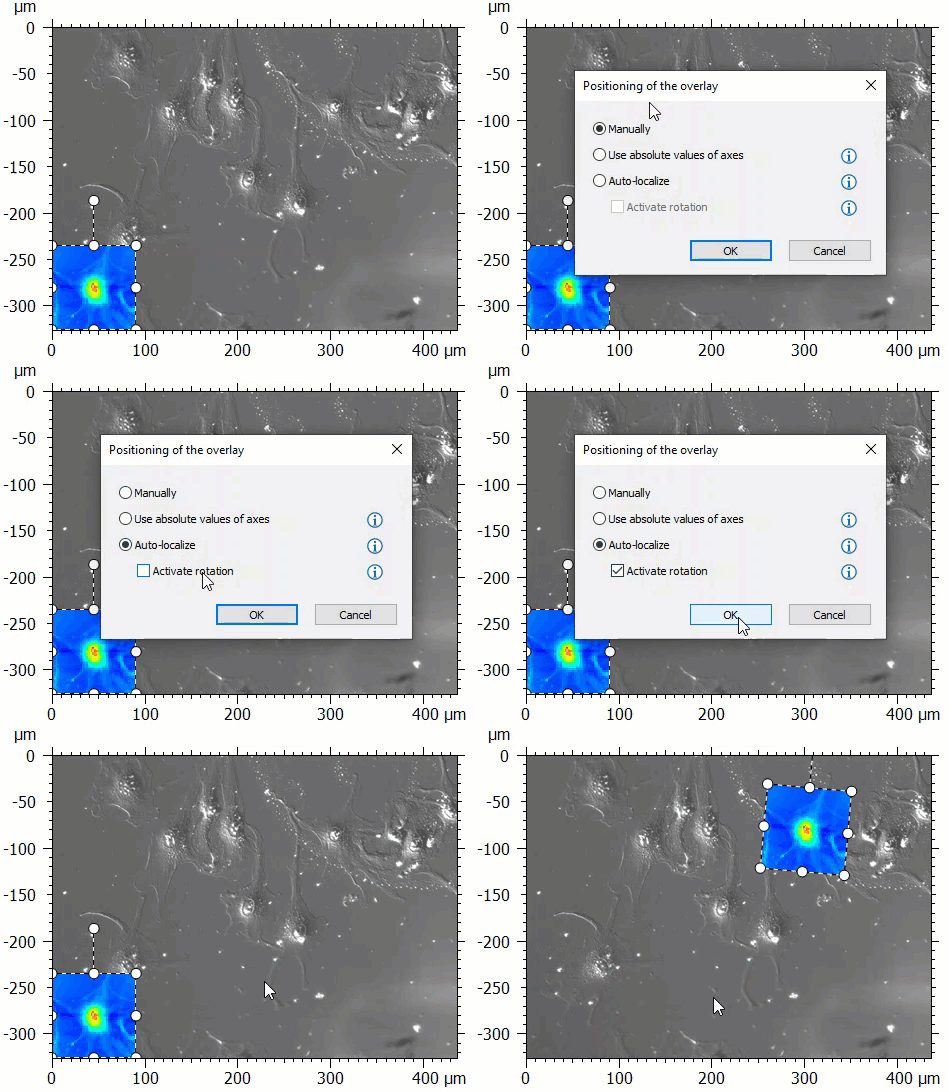
Above: Enhanced Colocalization tool (SEM+AFM data)
And more
For a full list of the changes and bug fixes published in this release, please visit our Software Updates page and download the release notes.
How to update to Mountains® 8.2
Access to this latest release is included in the Mountains® Software Maintenance Plan (SMP). Please visit our Software Updates page.
To find out more about SMP options, please contact sales@digitalsurf.revelateur.fr or visit this page.