Version 10 will see the Mountains® software family extend further, with the arrival of the new MountainsImage® branch, as well as a few other new additions.
We’re proud to now introduce MountainsImage® for light microscopy image analysis
This completes the current range which includes:
- MountainsMap®,for profilometry & topography analysis
- MountainsSEM®, for Scanning Electron Microscope image analysis
- MountainsSPIP® for Scanning Probe Microscope image analysis
- MountainsSpectral® for Correlative and Spectral Analysis
- and the multi-instrument solution MountainsLab®
The MountainsSpectral® range is extended with the addition of MountainsSpectral® Analyze for the analysis of spectra (Raman, IR, cathodoluminescence etc.)
3 new modules make their debut in version 10:
-
- Lens Analysis
- Shell CAD Compare
- Correlative Microscopy
The Fiber Analysis module is made available to users of MountainsMap®, MountainsSPIP® and MountainsSpectral® products.
Let’s take a closer look at what’s included in this new release.
Cross-technology features
Profilometry features
Correlation & spectroscopy features
SEM features
SPM features
Light microscopy features
Cross-technology features
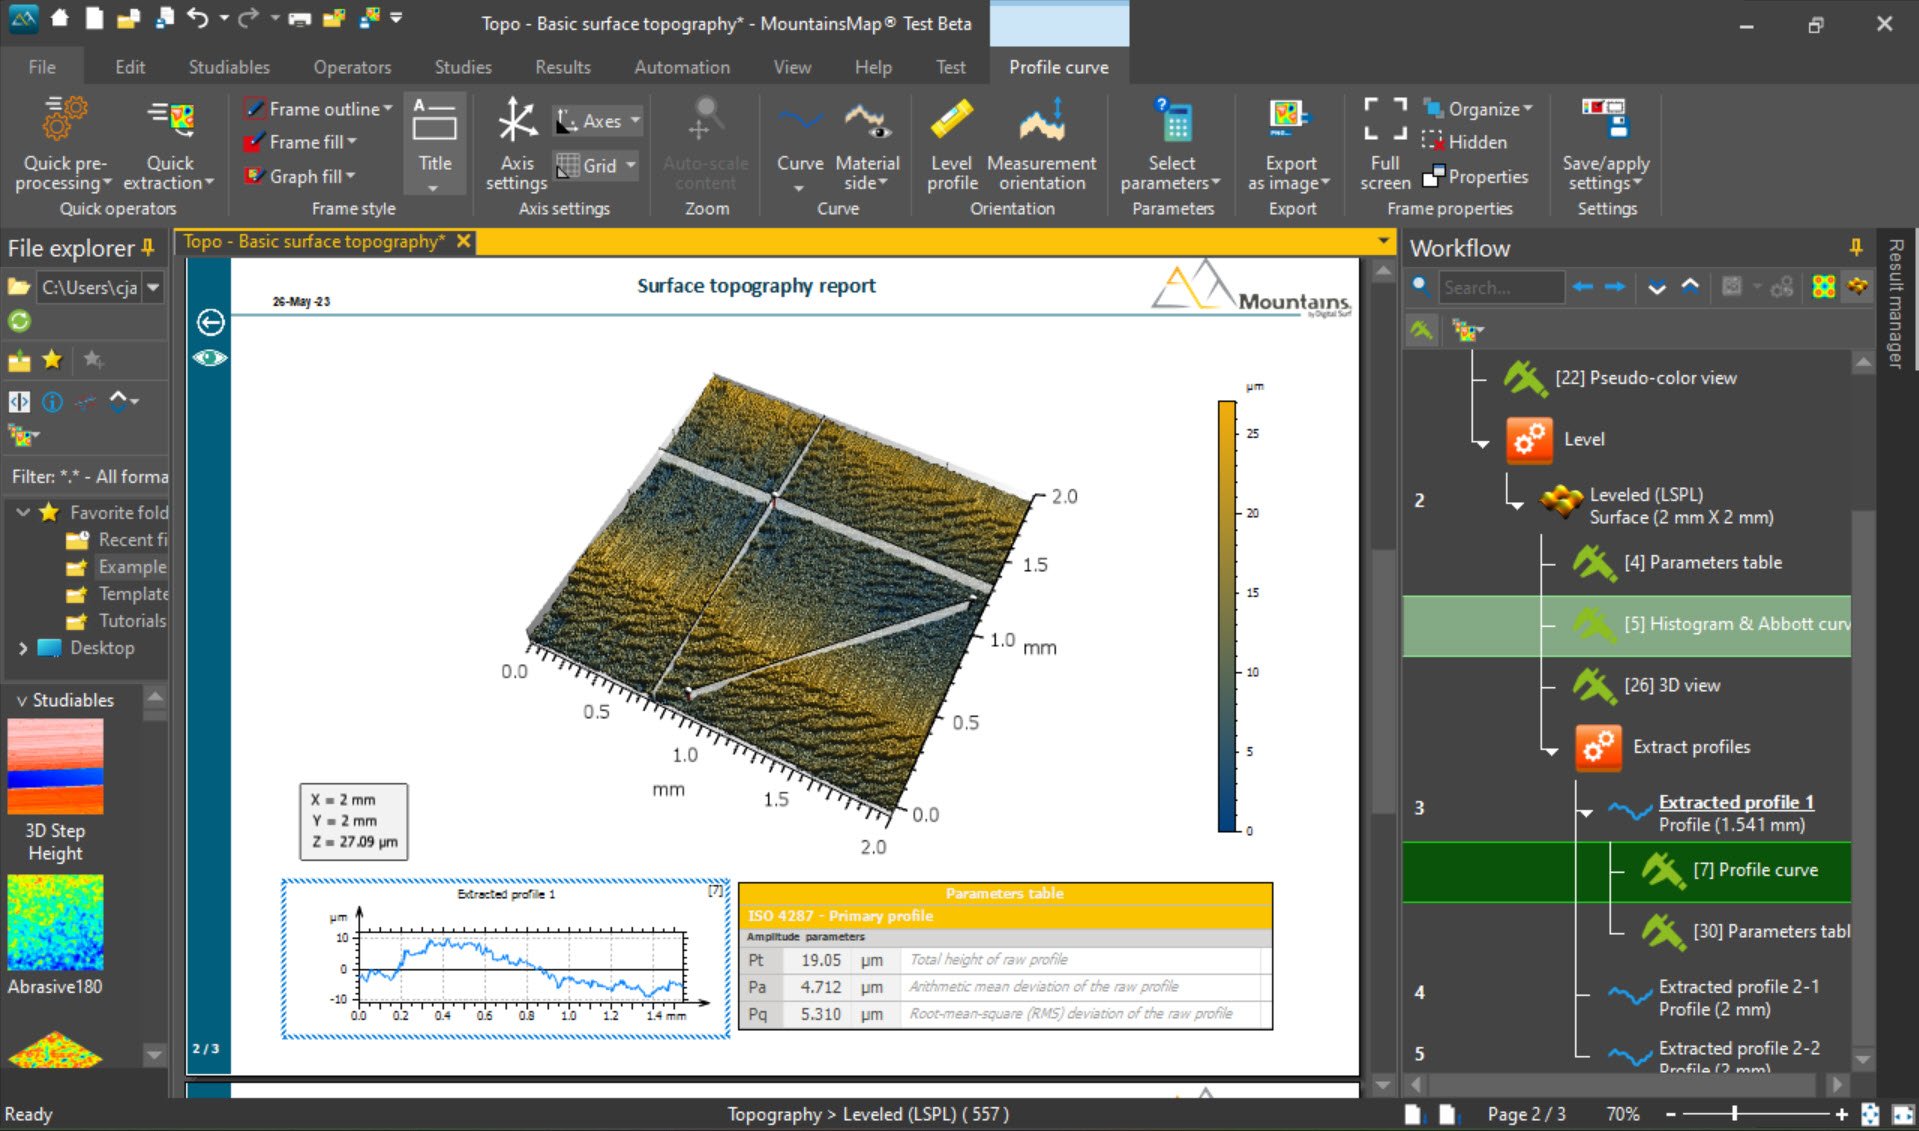
Extract profile tool augmented & redesigned
New tools added by popular demand
- Extract several profiles from a surface in one go and choose to generate individual profiles or series of profiles.
- Add/delete extracted profiles when you recall the operator
- Visualize extracted profiles using full scale or optimized range
- Activate/deactivate magnetic grid for profile extraction
- Quick extractions in just one click!
- Extract oblique profiles through highest/lowest point
- Extract circular profiles with their center at highest/lowest point
- Improved automation with the Result picker in profile extractions
- Visualize direction of extraction and width of averaging
- New extraction tools:
- Perpendicular profiles
- Parallel profiles
- Radial profiles
Automation: now even more accessible
Automation of your analysis process is key in today’s environment: in Mountains® 10, the interface for automation has been improved in more ways than one.

New Automation tab gives you a shortcut to all Mountains® productivity features:
- Substitution: substitute one or several datasets, your analysis document is updated instantly!
- Minidocs: create your own analysis recipes with a desired sequence of Operators and Studies and use them as a macro.
- Templates: as you work, Mountains® creates an analysis Document which can in turn be applied as a Template on similar datasets.
- Statistics: calculate statistics for one or more populations, whether they be static or dynamic
- Customization: save and reapply personalized Study settings, display etc. in order to work more quickly.
- Integration with data acquisition & machine operating software:
- Direct access to SDK, which has been further developed: now add operators or studies directly from your application and manage add-ons more easily.
Automation: Result picker extended
- Automate processes by reinjecting results : the Result picker feature is now available widely throughout the software, for example:
- Define profile position when using the Extract profile operator.
- In Parameters table : centralize a cut-off value applied to several Parameters tables or Filters.
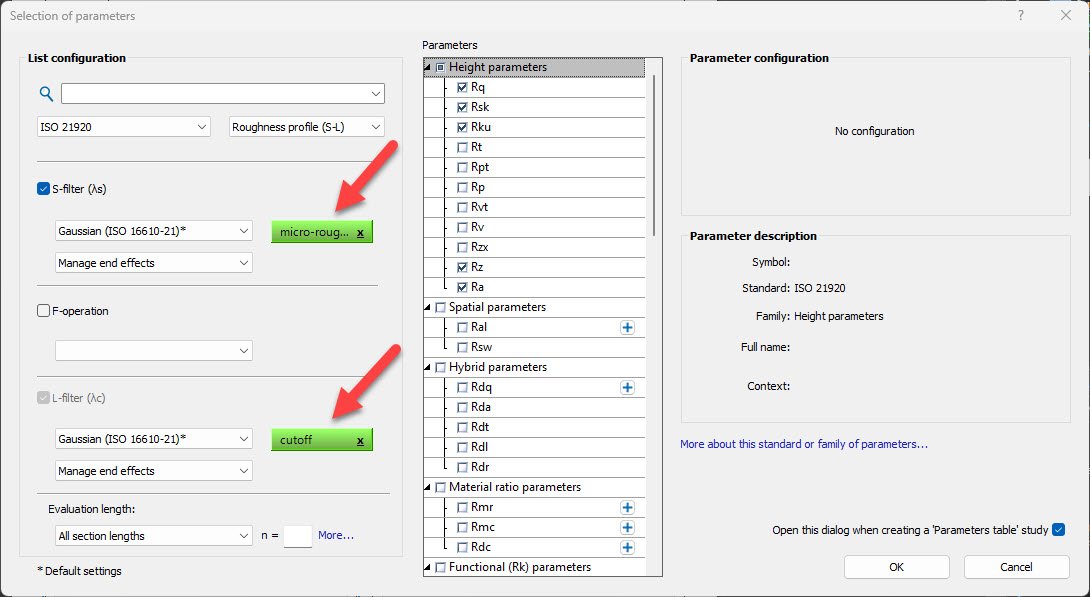
Above. The Result Picker (in green) allows users to automatically reinject calculated results to drive other processes.
Automation: detect structures automatically
- Automatically detect structures at a given position in Template mode
- Redesigned Operator dialog
- Manually select structures
- Generate structures by X/Y-position or choose to detect a defined number of structures with best correlation
Get more out of color palettes
- Compare zones more easily by creating and using color palettes with absolute values
- Attribute metric value to cursors in order to have same colors on different surfaces with same heights
- Create palettes with a “jump” between 2 colors, for example in order to visualize threshold effects
- Feature also available on min/max cursors in SPIP palette
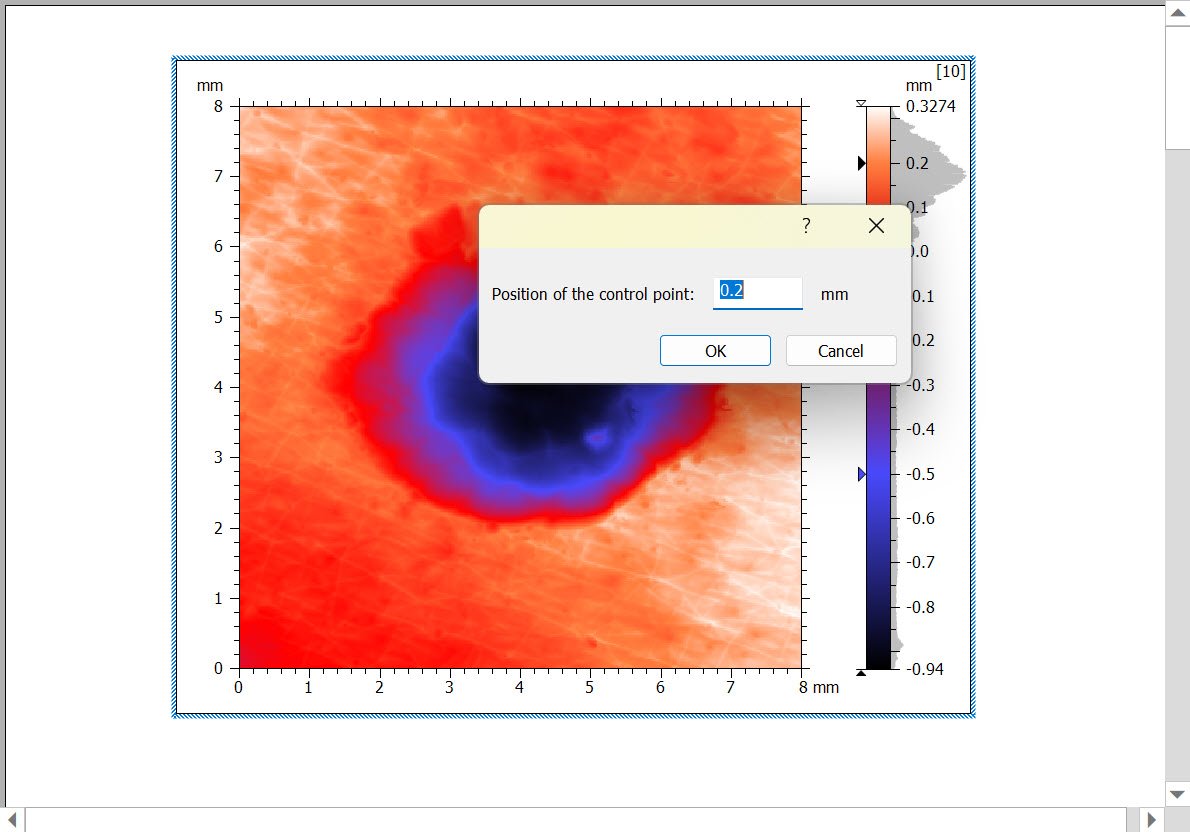
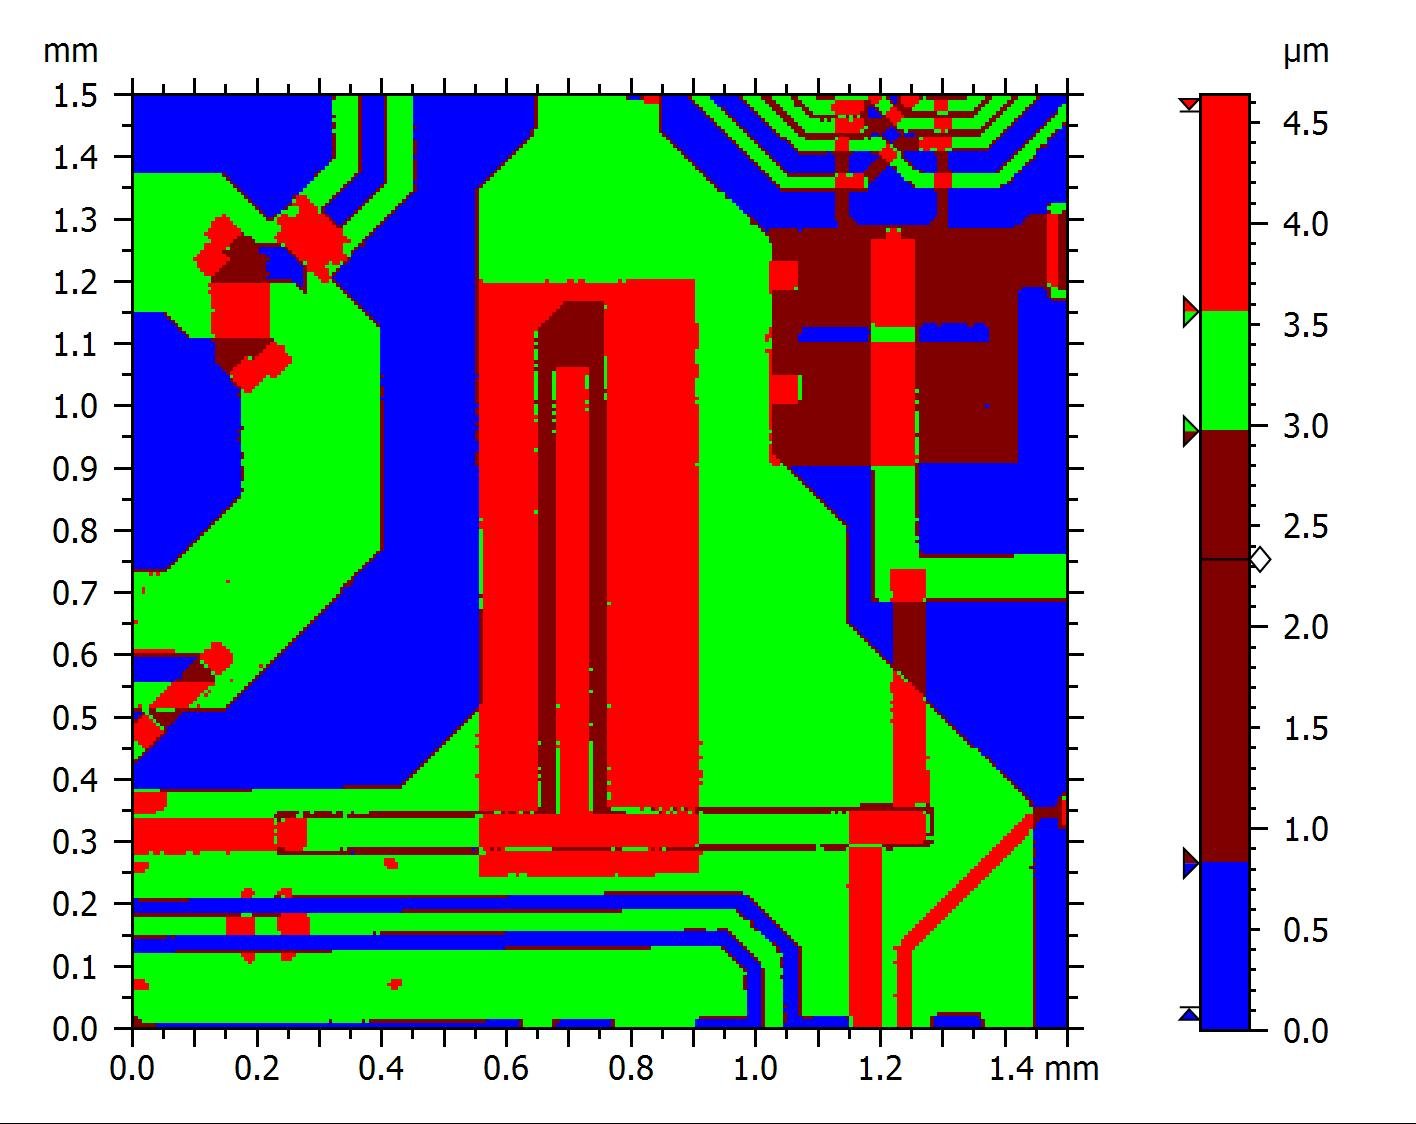
Above left. Use absolute values in color palettes – Above right. Create palettes with a “jump” between 2 colors.
A fresh look for the interface
- New theme available: dark gray
Other improvements
- Work more comfortably with resizable operator dialogs including option to go full screen for a number of commonly used operators (Extract profile, metrological filter etc.)
- Customize your Study titles more easily, add measurement date if available
- Identify Studiables more easily by name in Operator dialogs, Study dialogs, Legends and Identity card
Above. Some operator dialogs can now be resized and even made to go full screen
New features for Profilometry
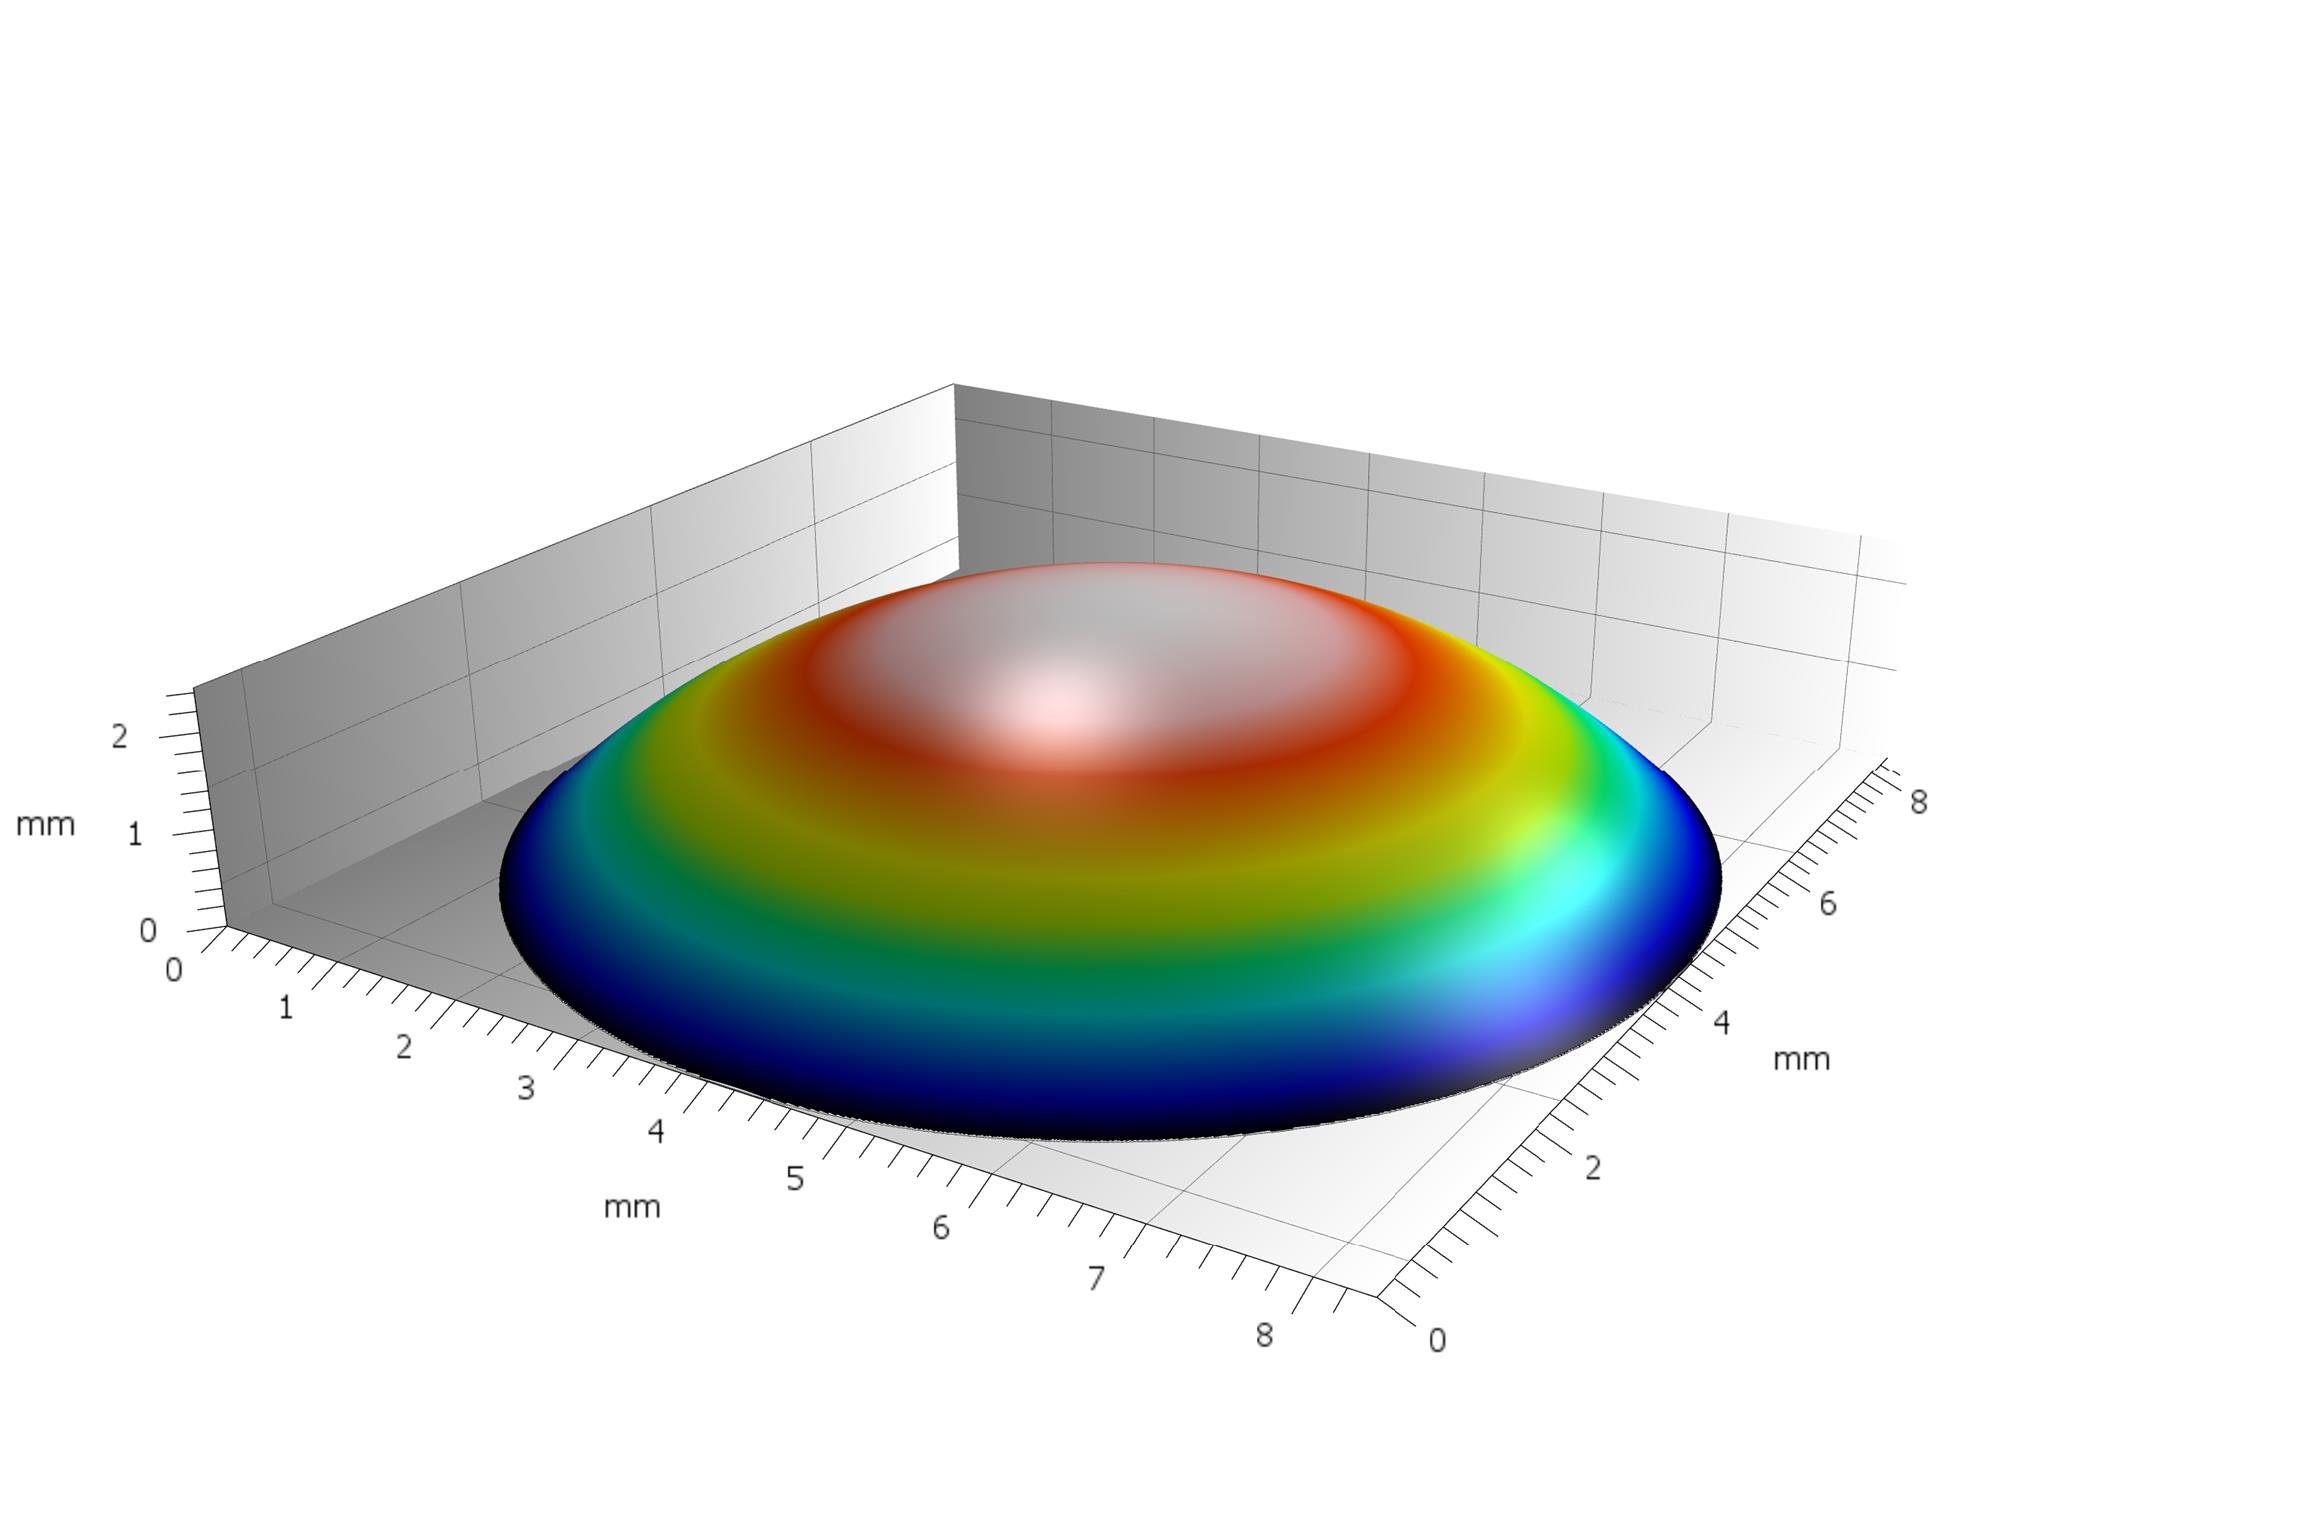
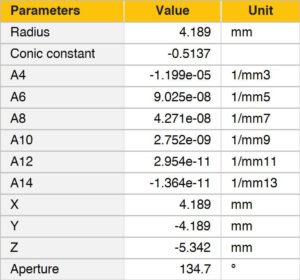
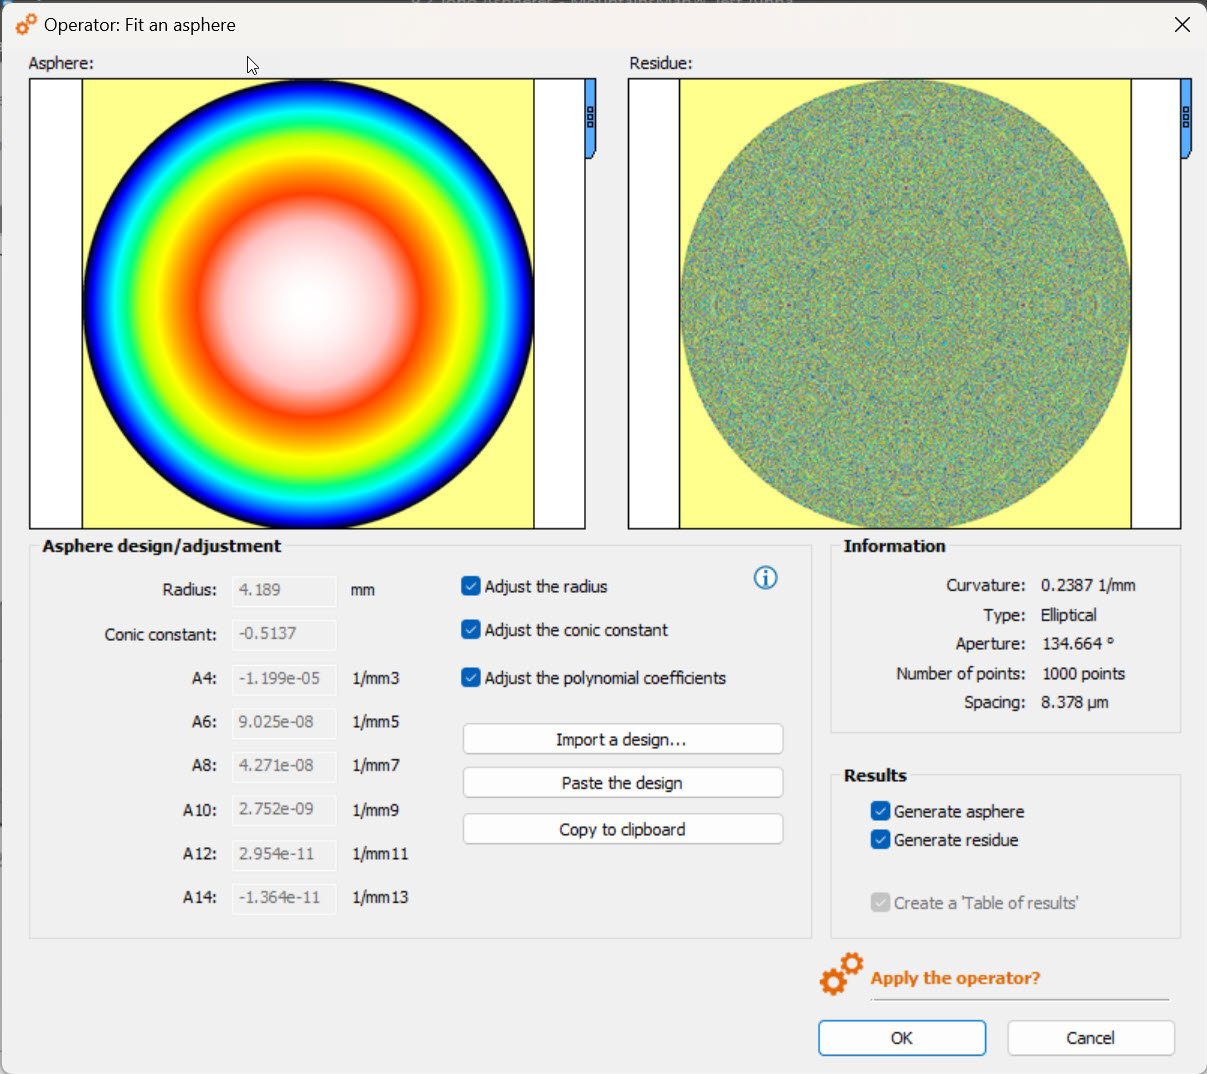
Lens Analysis module – analyze aspheric optics
- Analyze or simulate aspheric surfaces and profiles for imaging systems, sensors and laser applications in many industries
- Set reference geometry and adjust radius, conic contrast etc.
- Visualize residual surface (disparity between measured data and reference)
- Available as an optional module with MountainsMap® Imaging Topography, MountainsMap ® Expert, MountainsMap ® Premium, MountainsLab ® Expert and MountainsLab ® Premium
CAD compare on Shell studiables
- Compare measured Shell data (actual) with CAD models (nominal) or generated meshes (in additive manufacturing)
- Pre-align models automatically or manually (using point selection) – useful in the case of partial measurements
- Fine-tune fitting
- Calculate and show deviations using user-defined color palettes
- Generate result Shell and deviations in order to carry out further analysis (surface texture analysis etc.)
- Available as an optional module with MountainsMap® Topography, MountainsMap® Imaging Topography, MountainsMap ® Expert, MountainsMap ® Premium, MountainsLab ® Expert and MountainsLab ® Premium
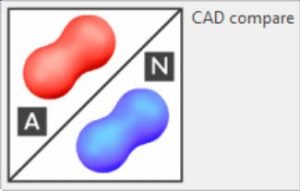
Above. Examine deviations between measured Shell and CAD model.
Point clouds: remove outliers, mesh improvement
- Remove outliers from point cloud data:
- Clean up your data before analysis
- Remove abnormal points resulting from measurement errors
- Remove whole measured pieces not to be taken into account for calculations (sample stage, part of a neighboring piece etc.)
- Improved meshing:
- Mesh the point cloud operator now works in a greater number of cases, including cylinders with parallel profiles
Above. Remove outliers from point clouds including areas not to be analyzed (here in red)
More tools for series of profiles & surfaces
- Level, Morphological filter and Scale-Sensitive Fractal Analysis tools can now be applied to a series of profiles or surfaces, allowing you to work faster and process large batches of data
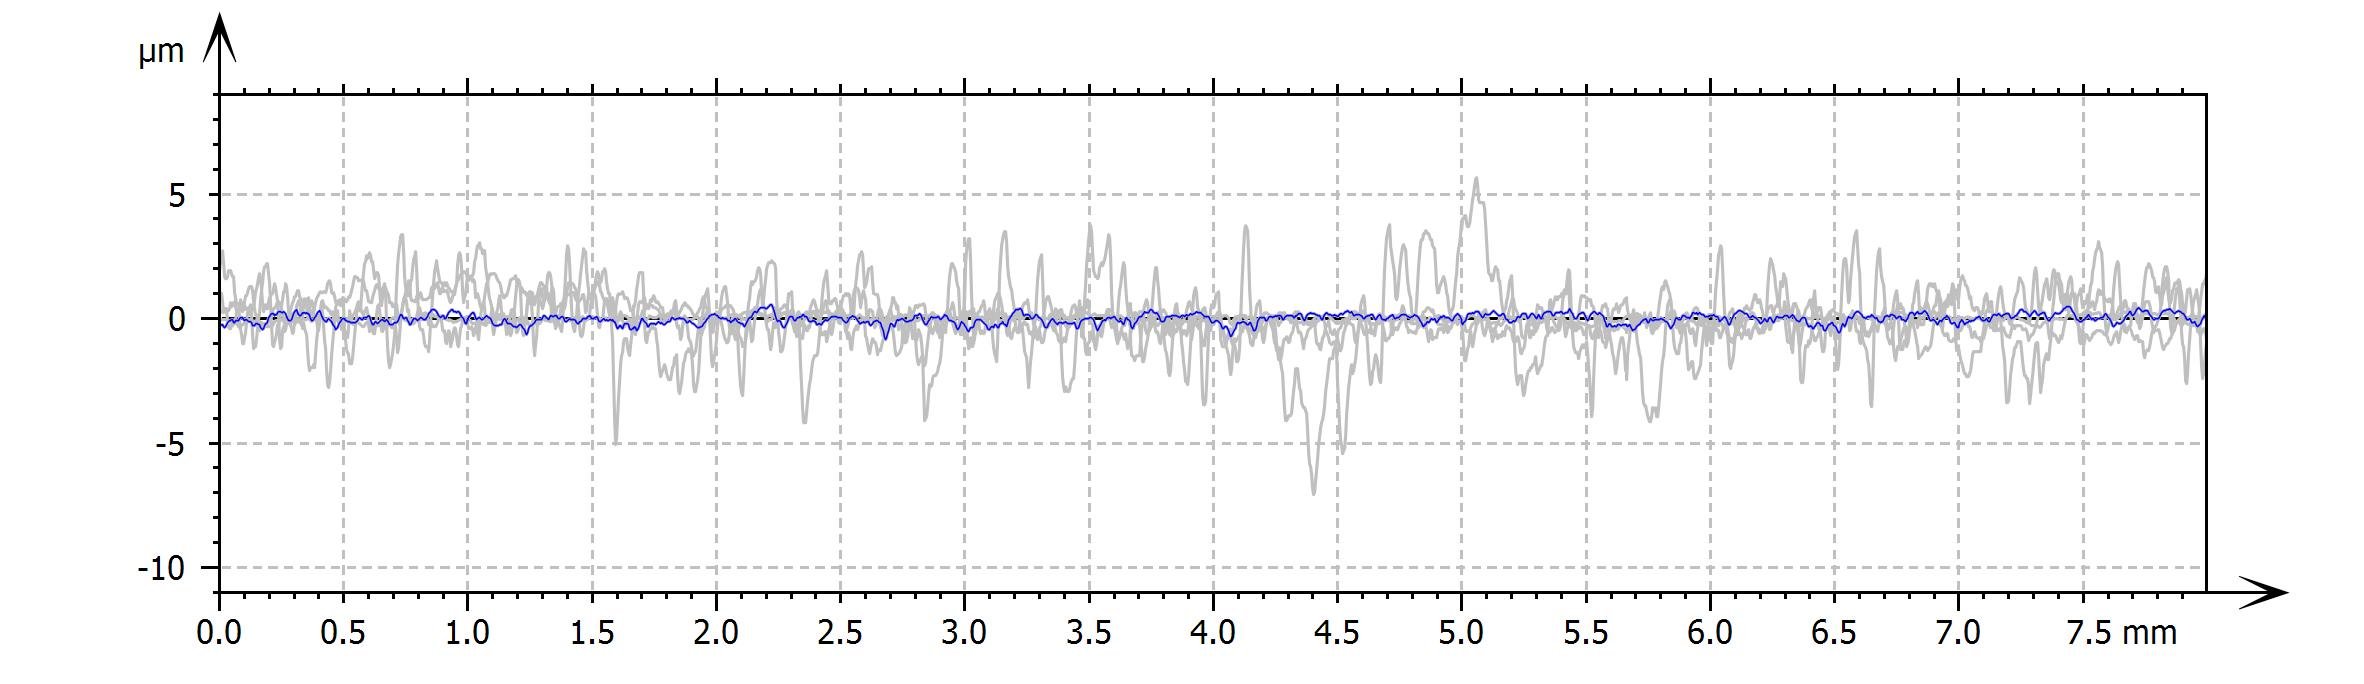
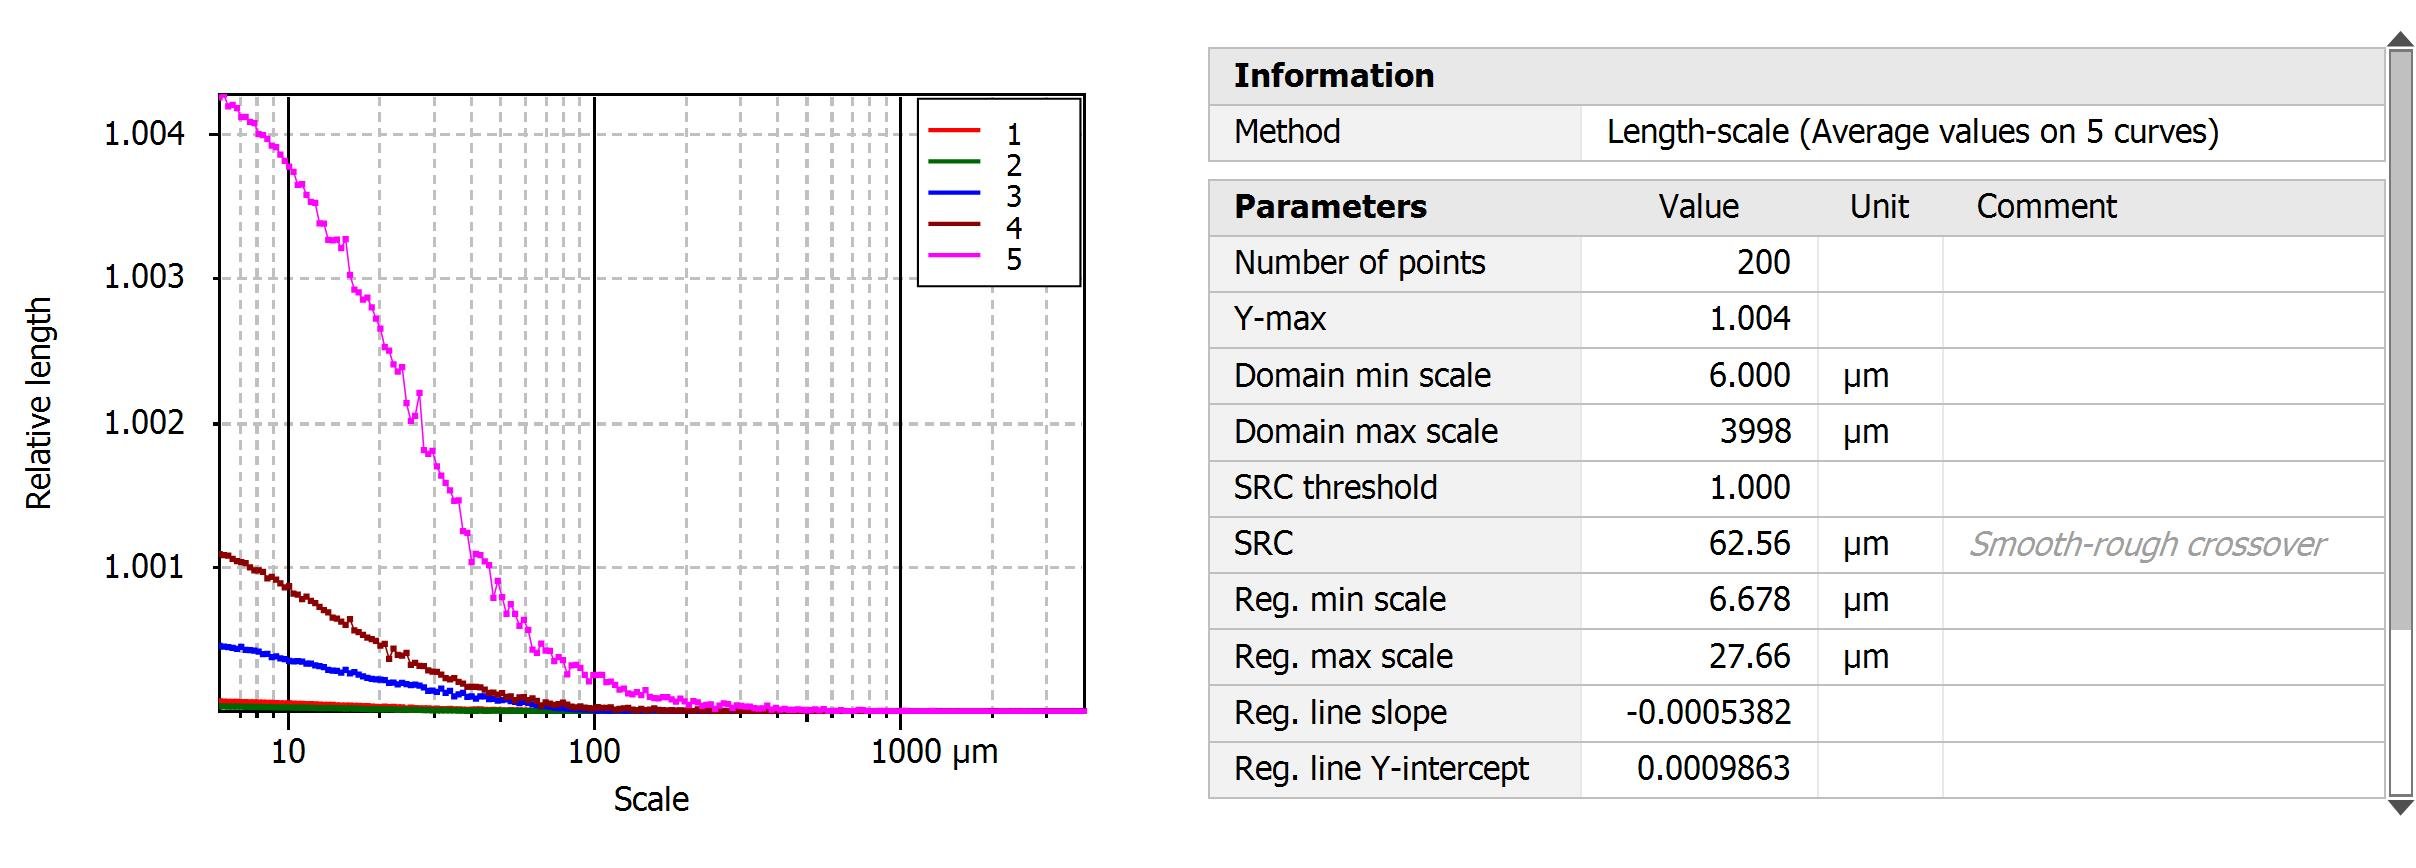
Above. Scale-Sensitive Fractal Analysis on a series of profiles
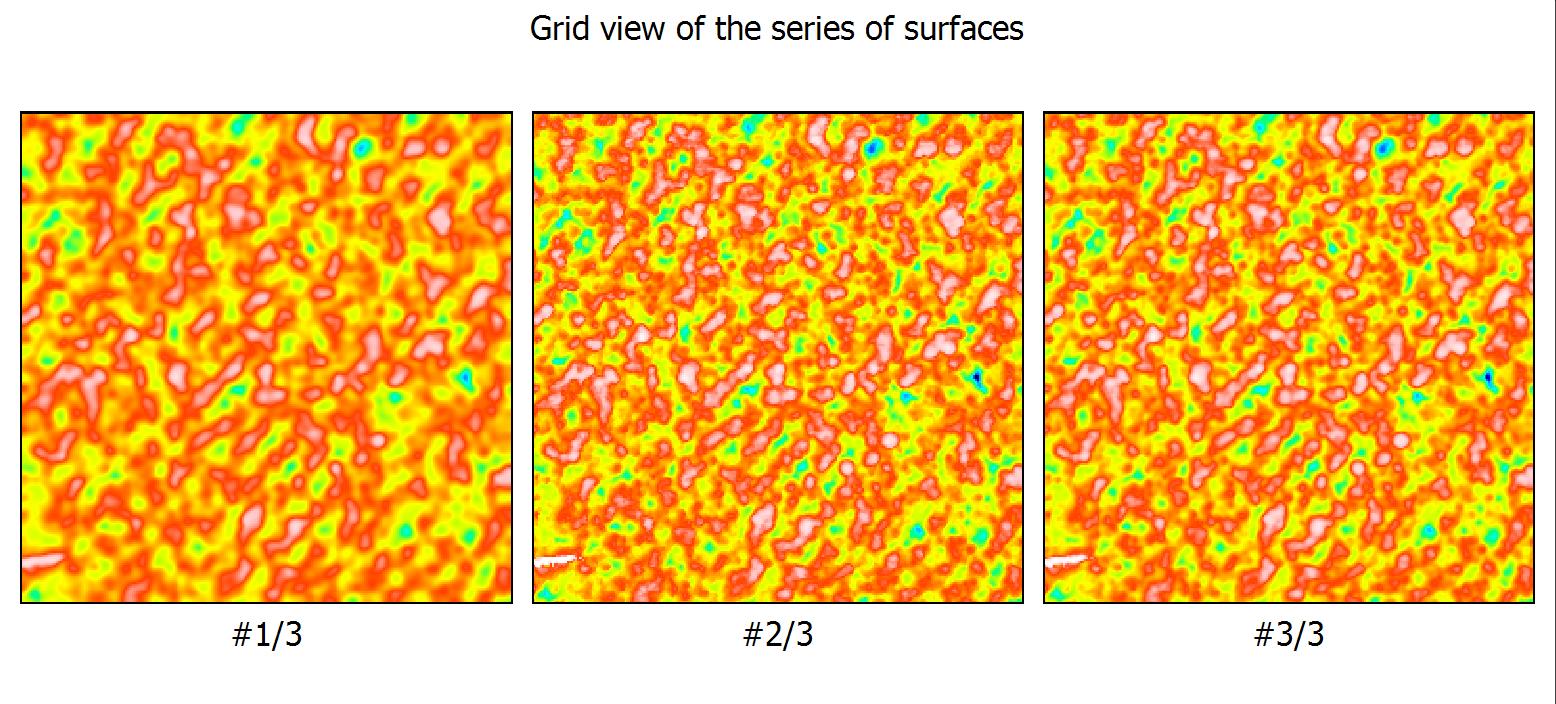
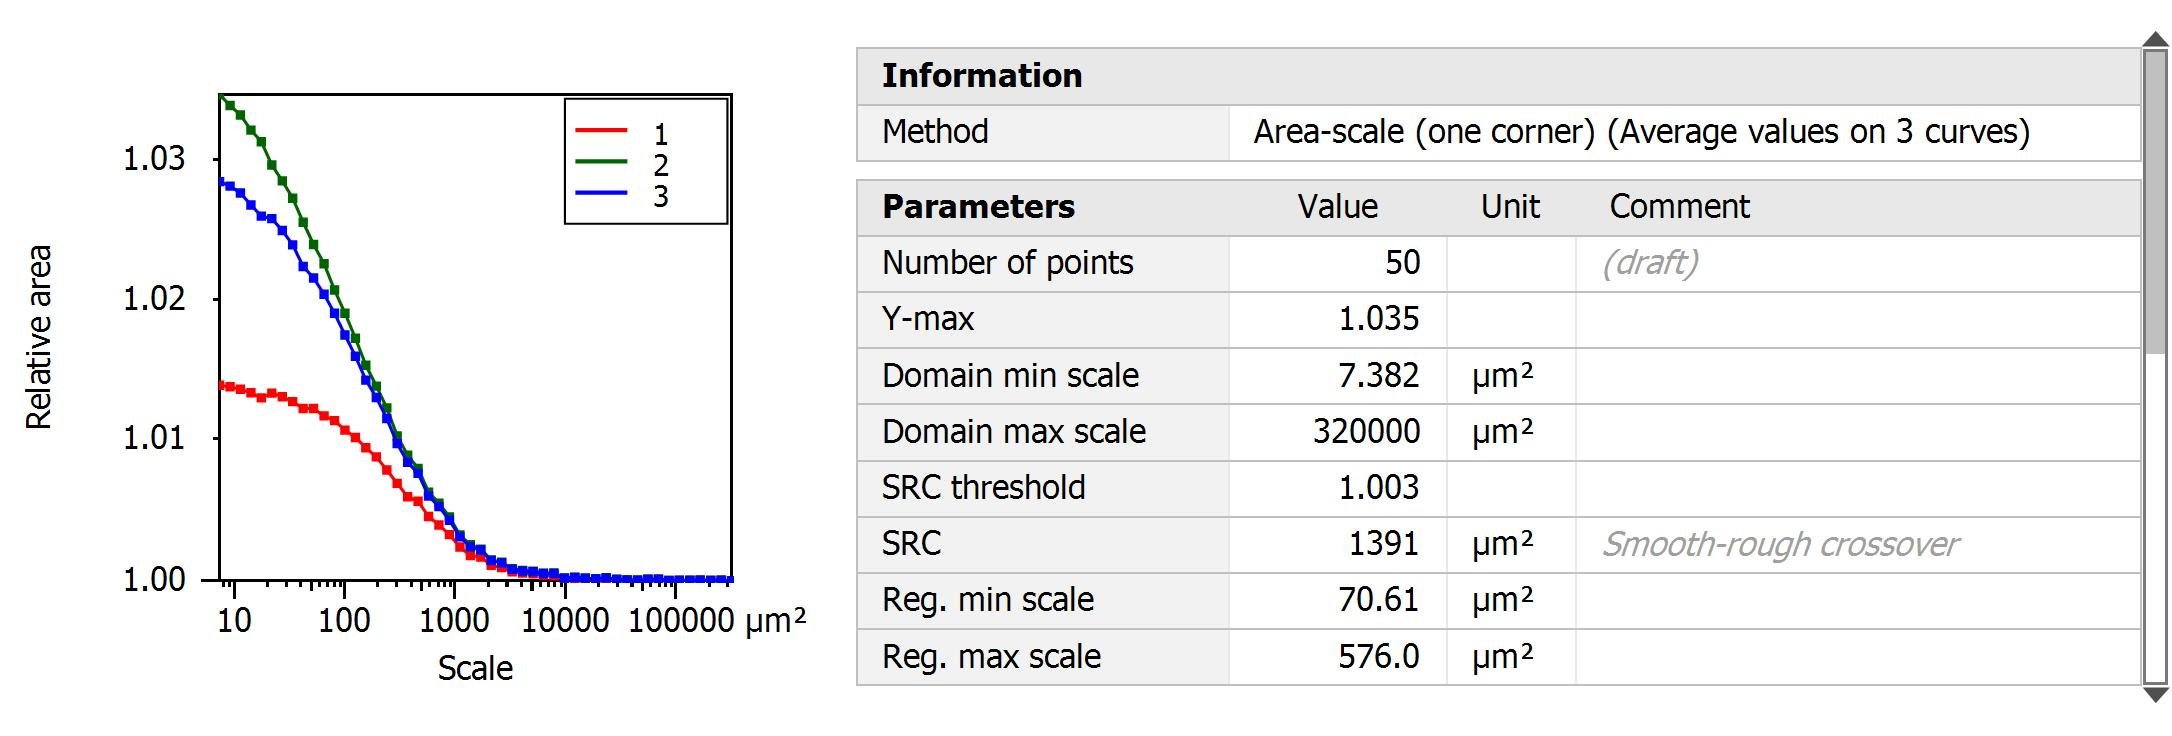
Above. Scale-Sensitive Fractal Analysis on a series of surfaces
Show images beneath contour profiles
- Show images (or surfaces) beneath contour profile, when analyzing horizontal object contour
- Adjust transparency & color palette
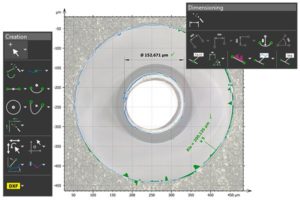
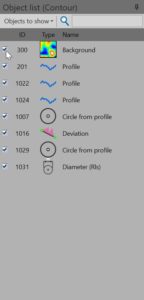
Above. Show an image beneath the Contour Analysis Study and adjust transparency
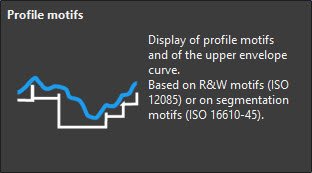
New 2D motifs parameters
- Characterize repeating patterns (peak-valley-peak) with new 2D motifs parameters (ISO 12085)
- Useful for analyzing dissymmetric profiles
- Generate statistics and ratios (for example Rmdc %, Rmsl slope etc.)
- Check standard deviations
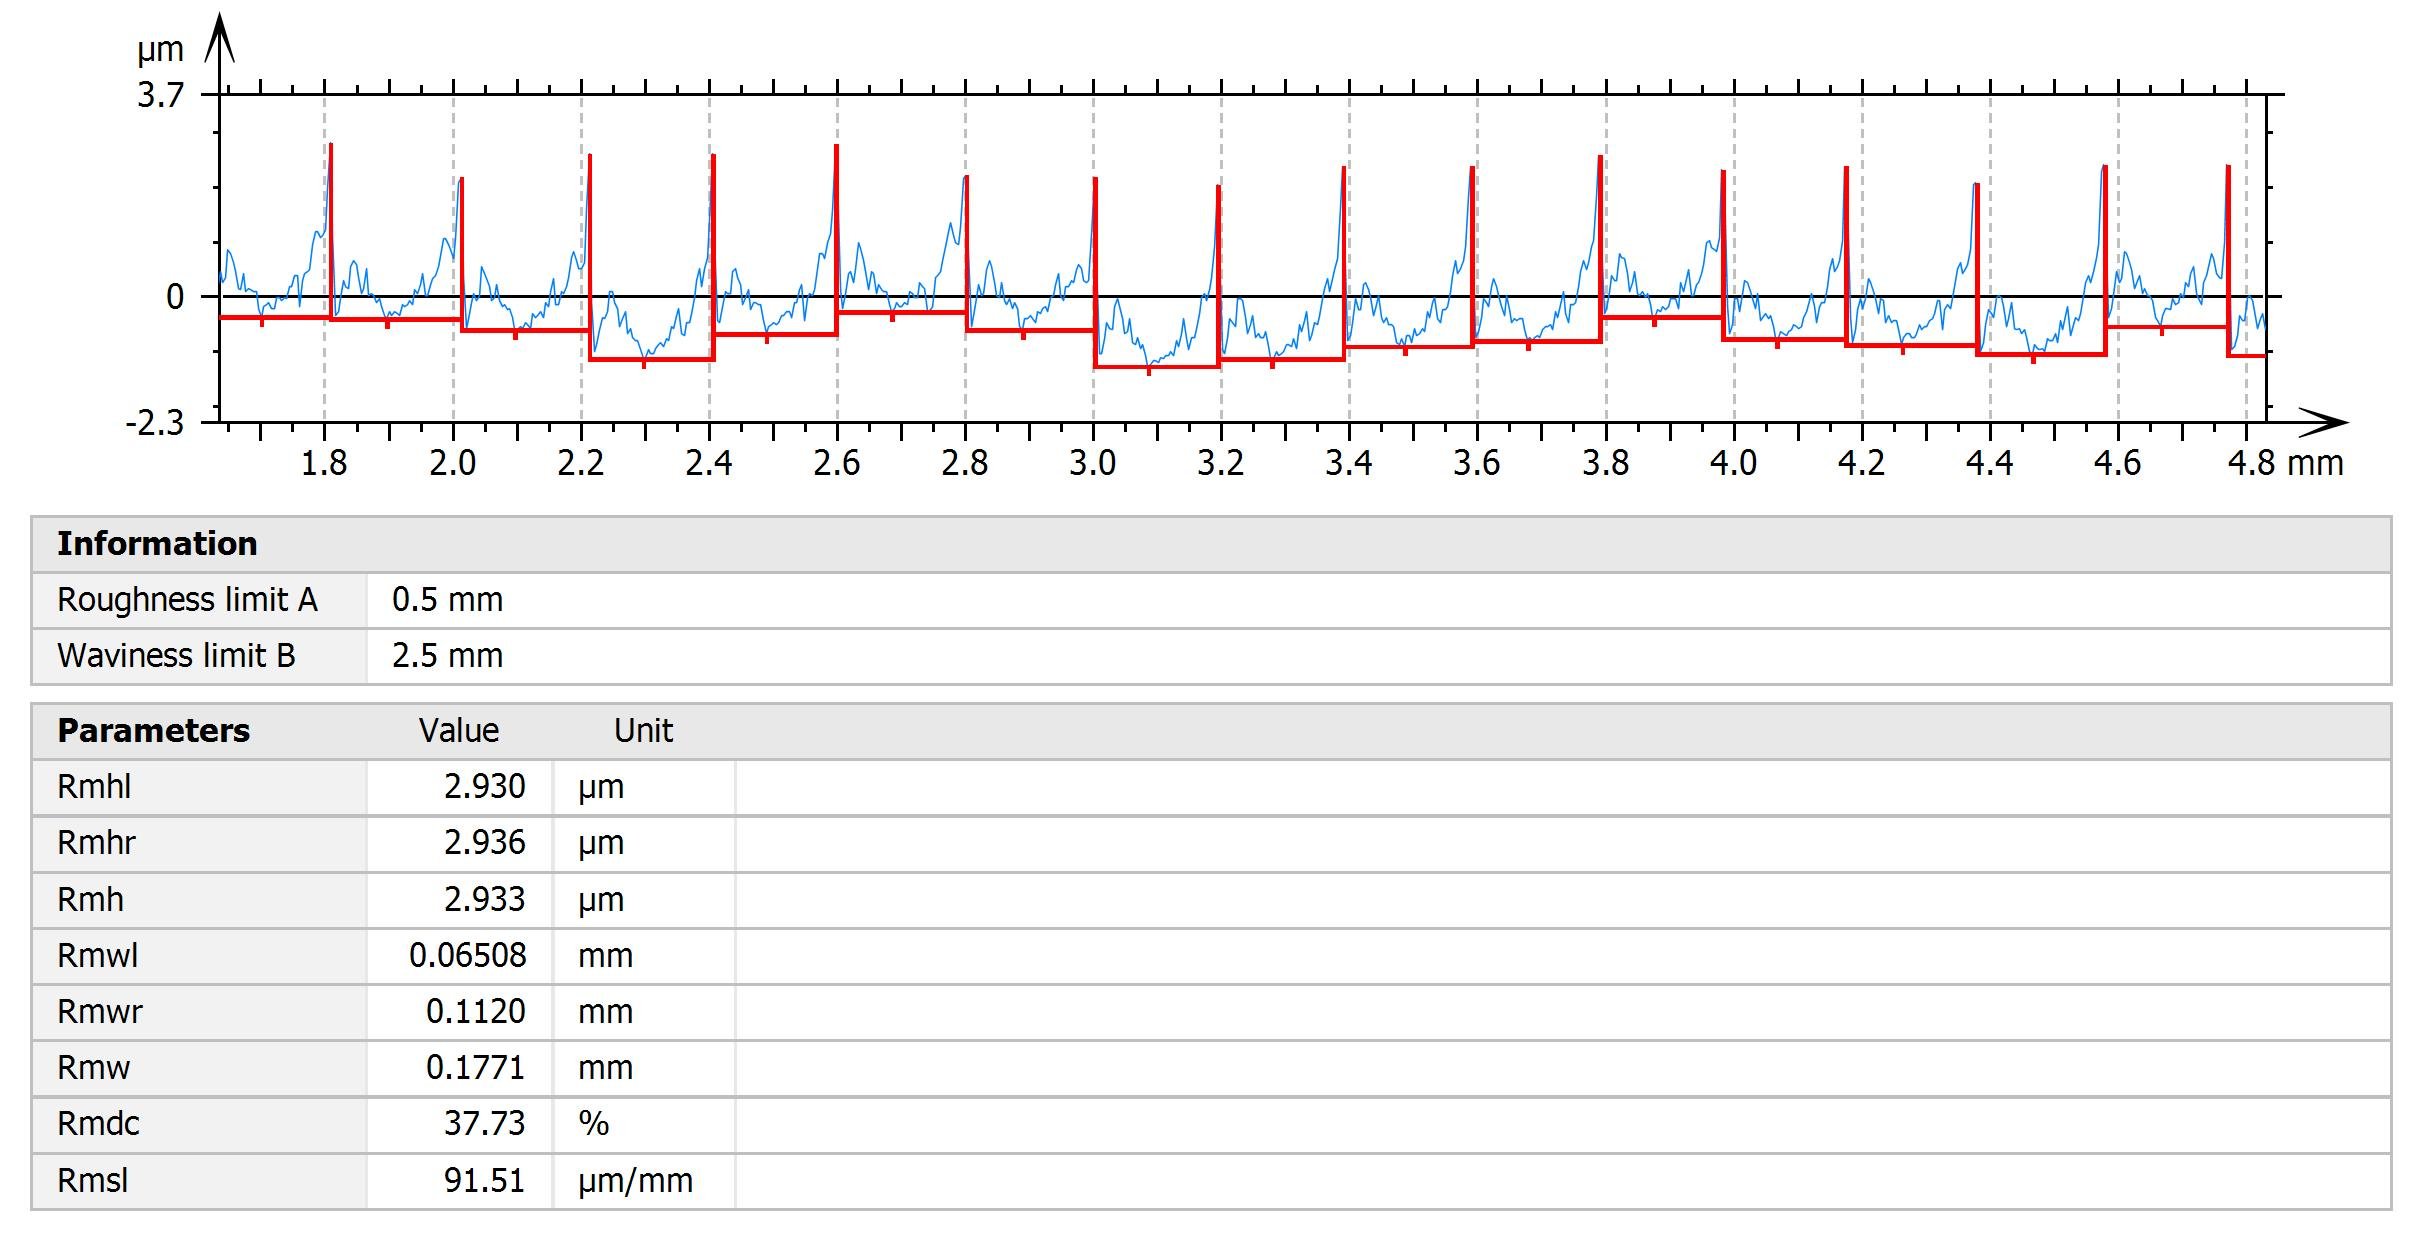
Fiber analysis on topographic data
- Analyze fibers in 3D topographical datasets of composite materials, non-woven fabrics, cellulose derivatives etc.
- Detect fibers and interstices automatically and calculate parameters: mean, min/max diameter of fibers, standard deviation, coverage, orientation etc.
New features for Correlation & spectroscopy
Analyze spectra from A to Z
- New product in the MountainsSpectral® range: MountainsSpectral® Analyze for the complete spectral analysis of Raman, IR, cathodoluminescence spectra etc.
- For users working with spectra only (without imagery) for ex. those working with time series (for ex. inline/online analysis)
- Visualize and analyze individual spectrum curves or series of spectra
- Get spectra ready for analysis: correct the baseline & filter to remove noise
- Access various display options (style, axis, curves to display, envelope etc.)
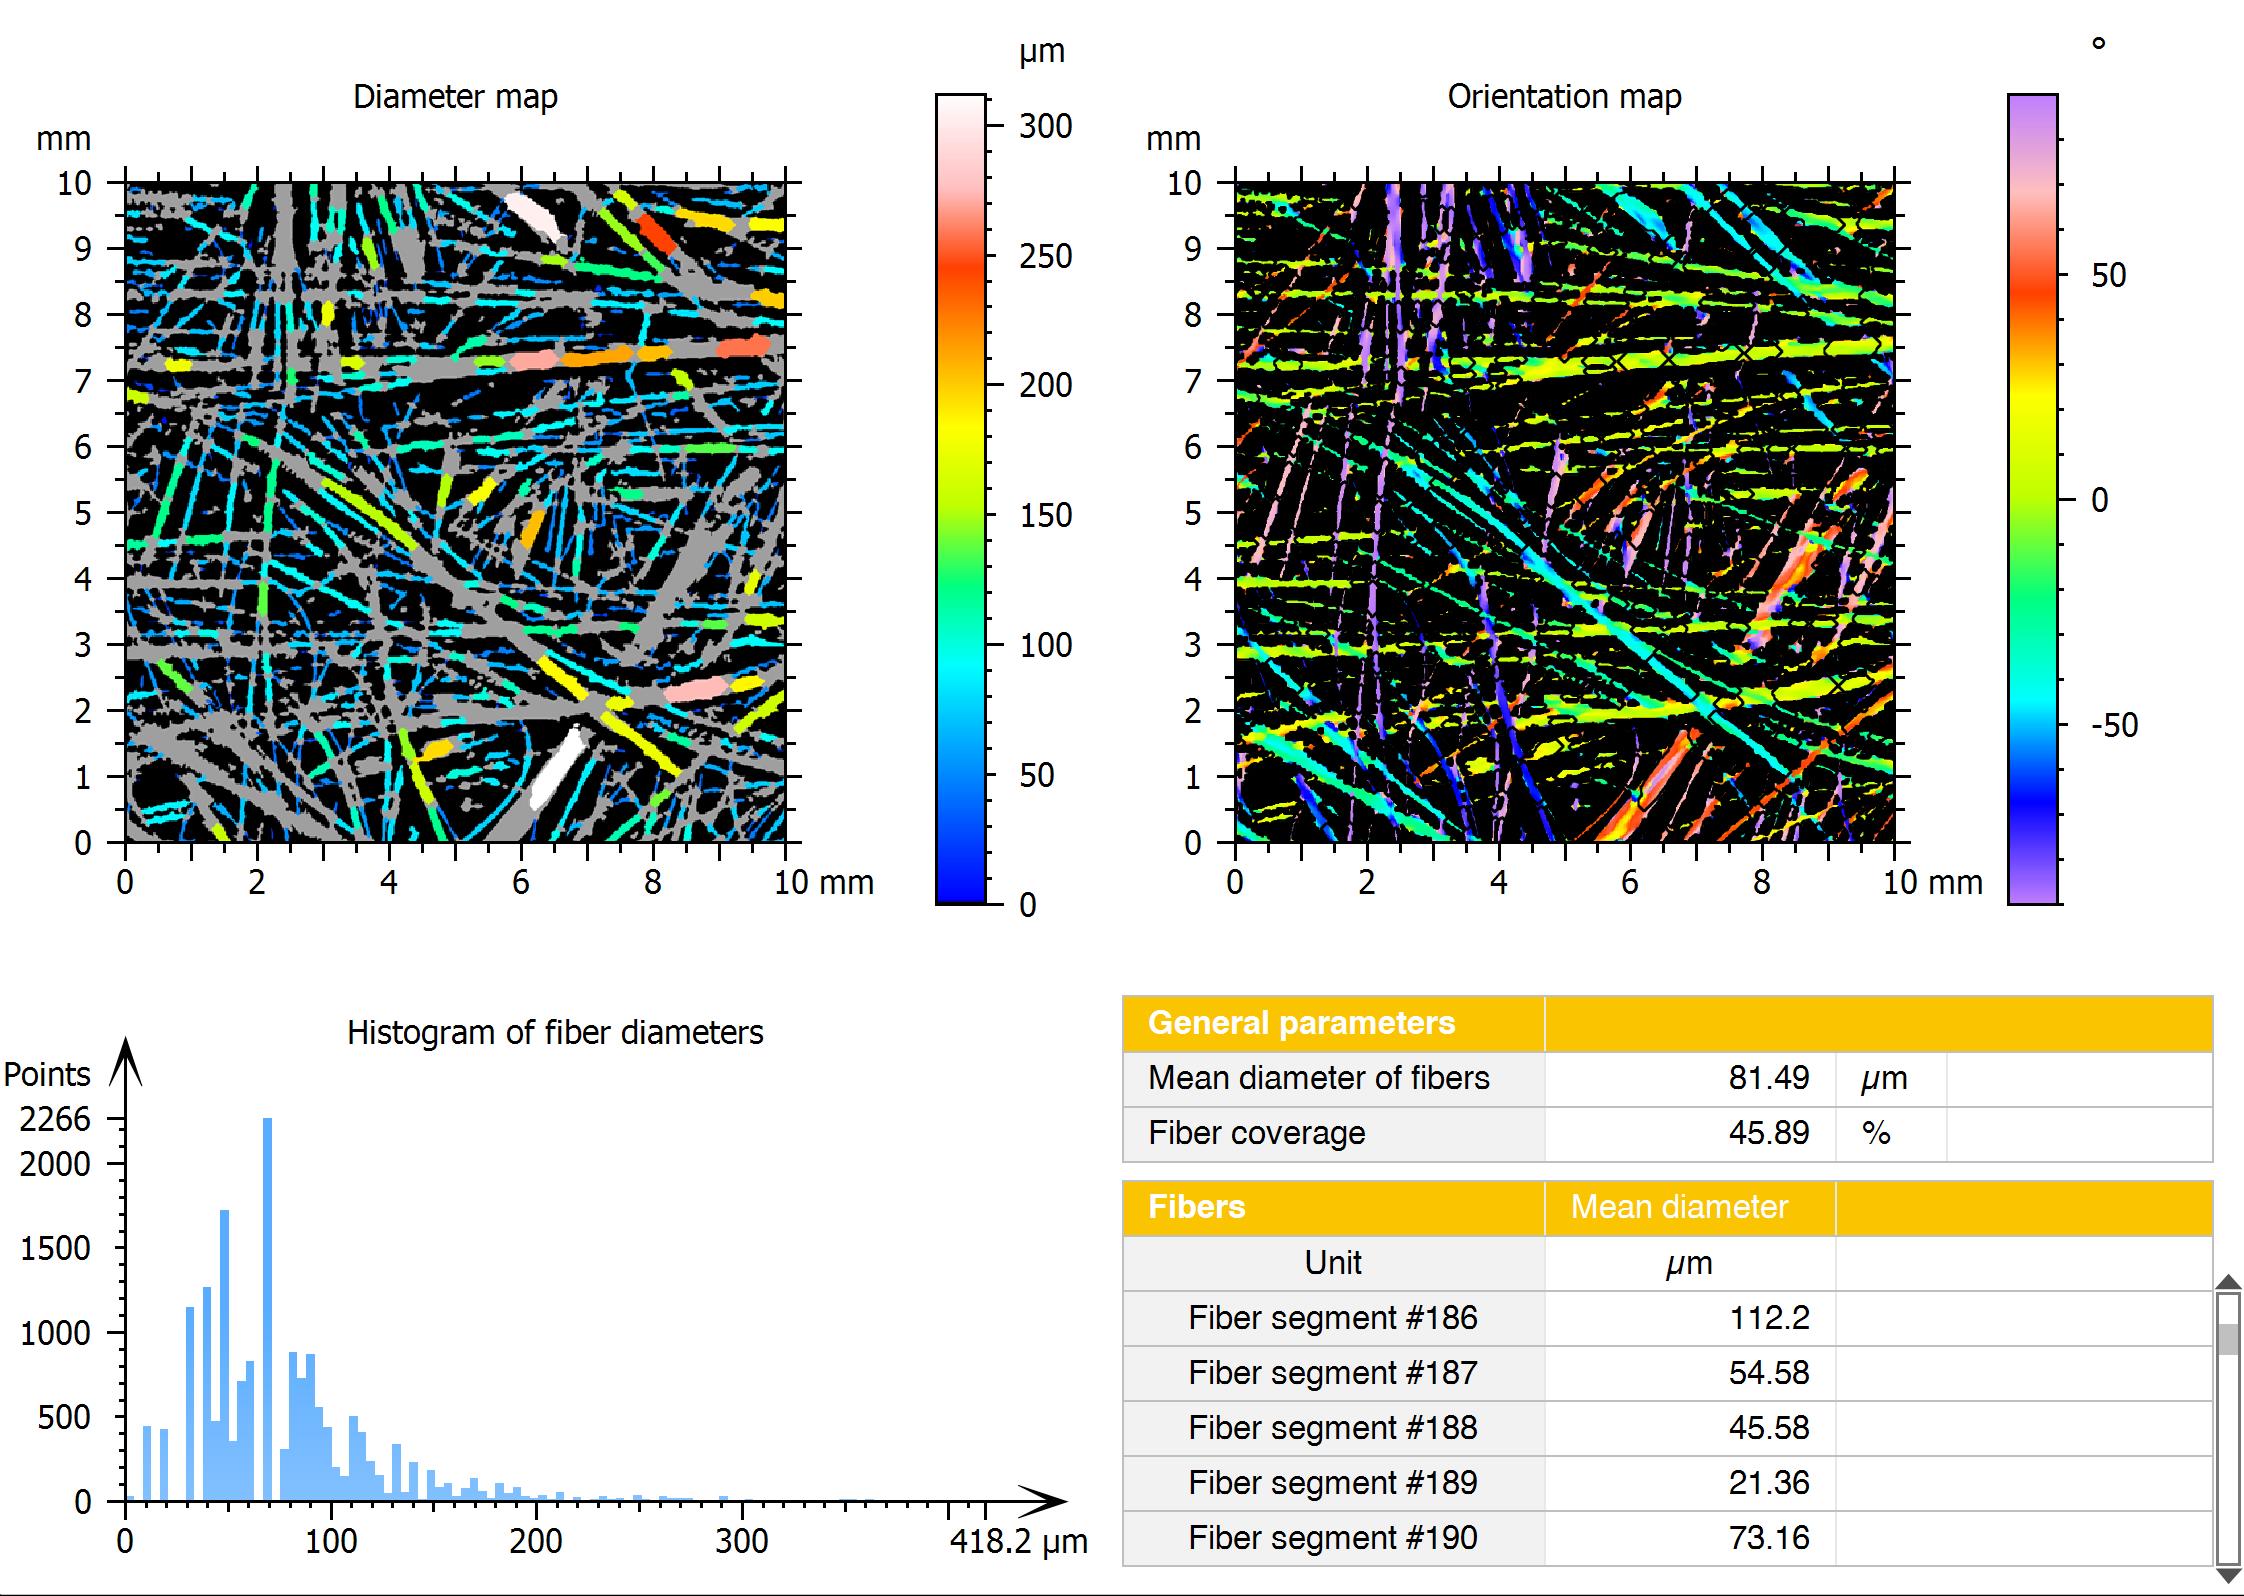
- Detect and fit peaks manually or automatically
- Generate parameter maps
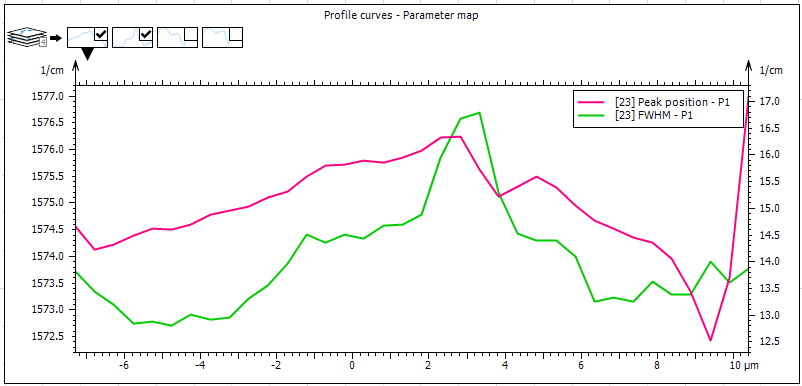
Above. Peak fitting on a series of spectra (left) and spectral profile (right).
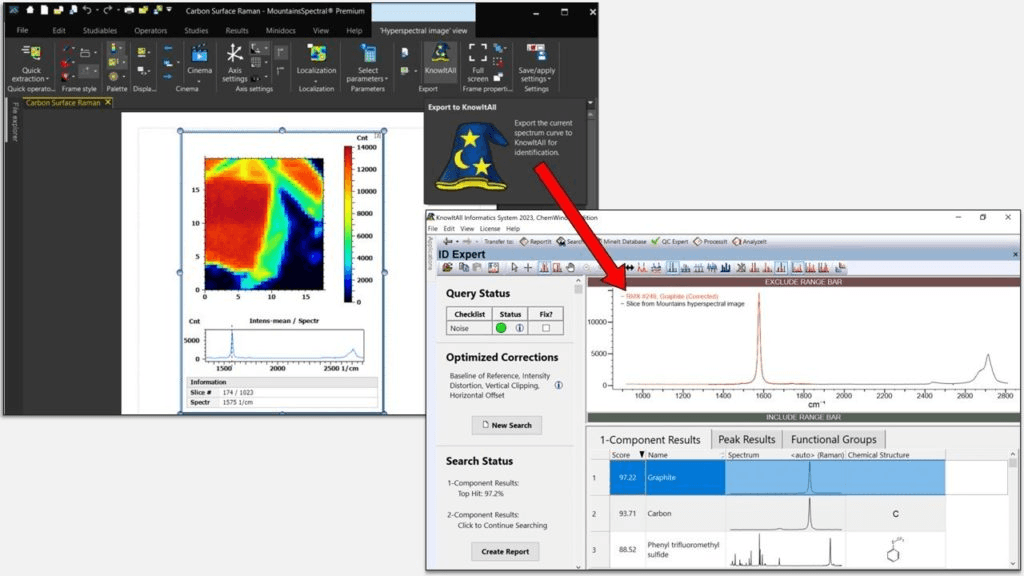
Quick export to Wiley’s KnowItAll software
- Effortlessly send spectra from spectroscopic images (Raman and IR: FTIR, ATR, NIR) direct to Wiley’s KnowItAll software to analyze components
- Take advantage of KnowItAll’s powerful search and prediction algorithms and vast spectroscopic data collections
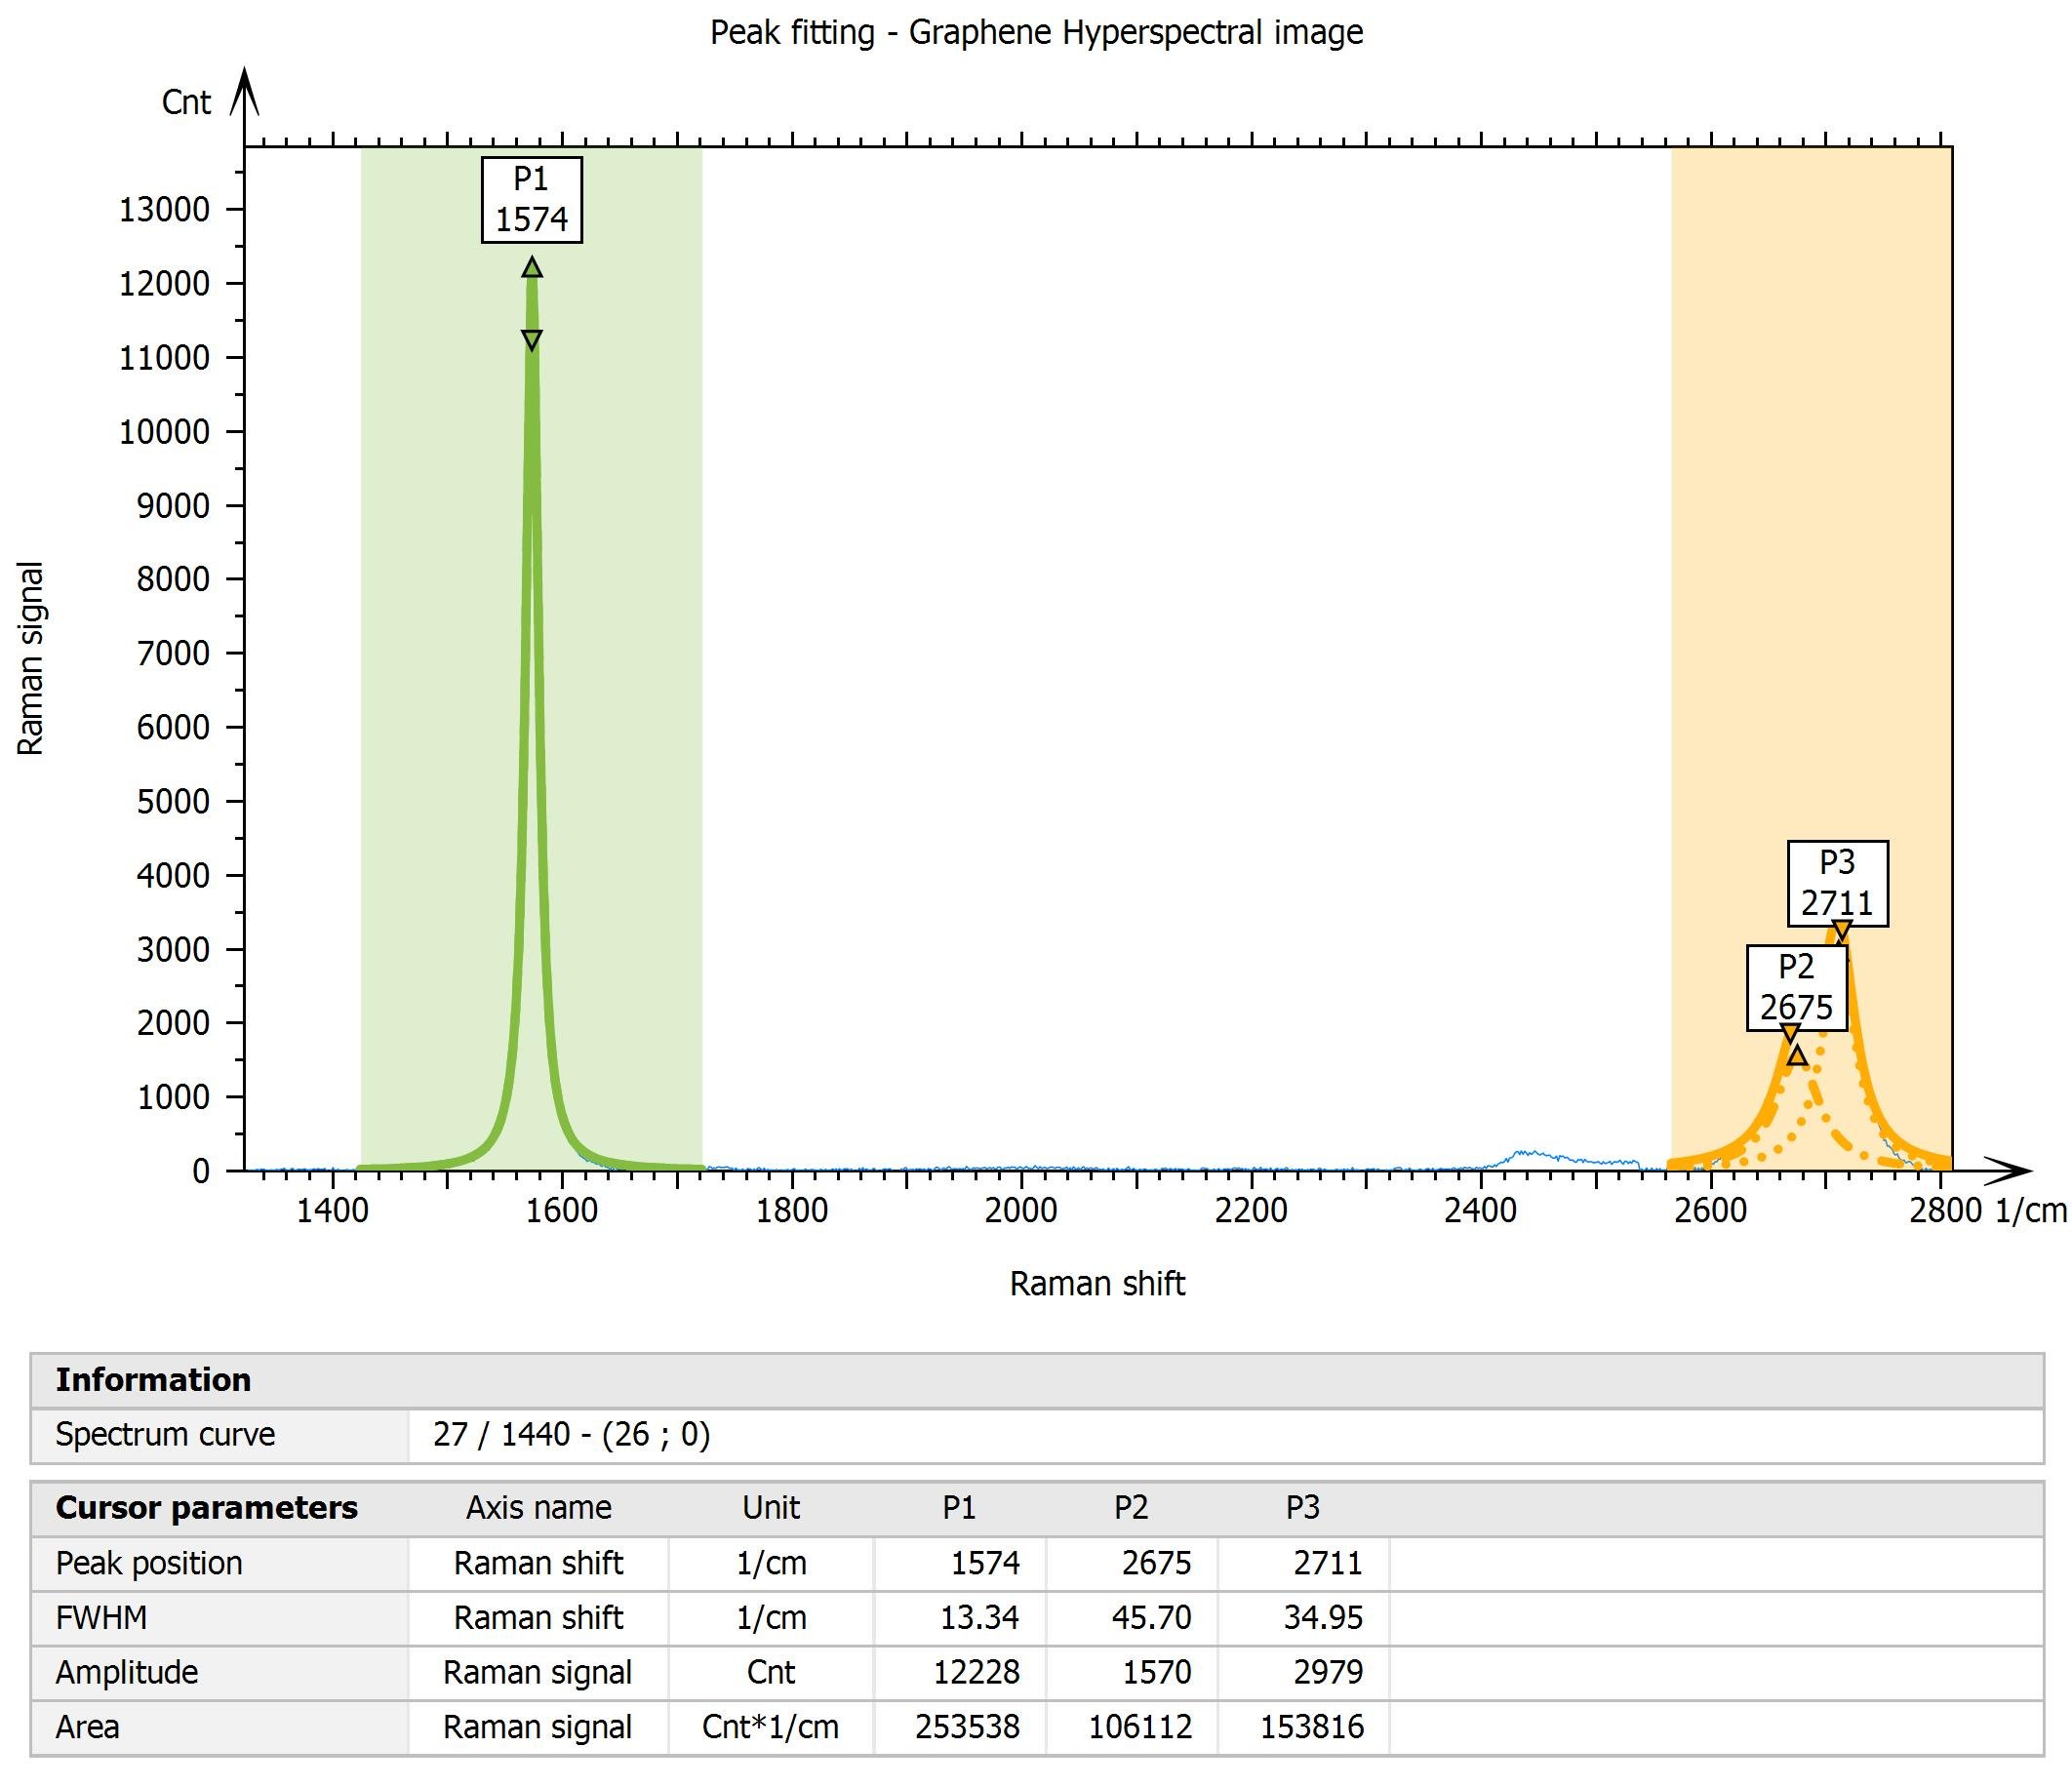
Peak fitting (deconvolution)
- Peak Fitting now available on series of spectra and hyperspectral images
- Inject peak characteristics into statistical studies or the new Parameter map Operator
- Calculate area under the peak and offset from a peak position
- New, improved interface makes peak fitting easier to perform
- Apply Automatic baseline tool when using peak fitting feature
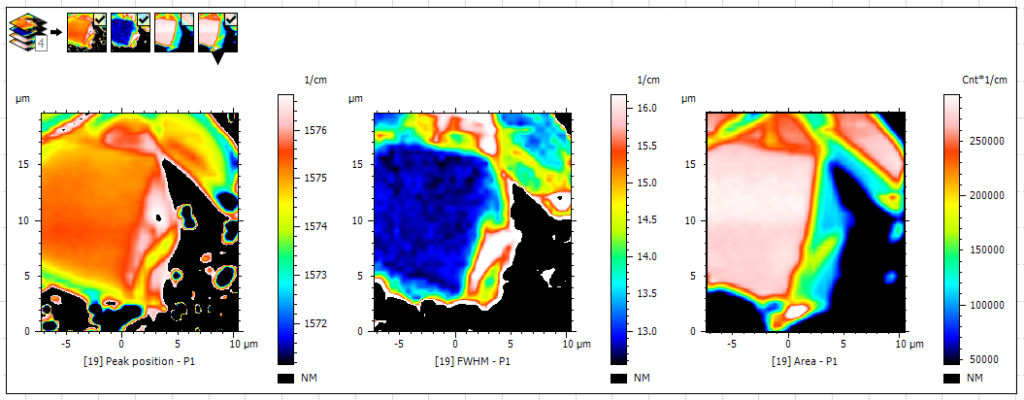
Parameter map of peak positions
- Investigate physical or chemical nature of samples by generating parameter maps
New Correlative Microscopy module
- New module added to serve the needs of the Correlative Microscopy community
- Process data from spectroscopic techniques including Raman, TERS, FT-IR, nanoIR, fluorescence, photoluminescence, cathodoluminescence, EDX/EDS and XRF
- Perform correlative analysis
- Process spectral maps, enhance and adjust composition
- Correct and enhance image data
New features for SEM
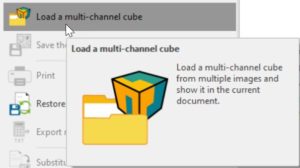
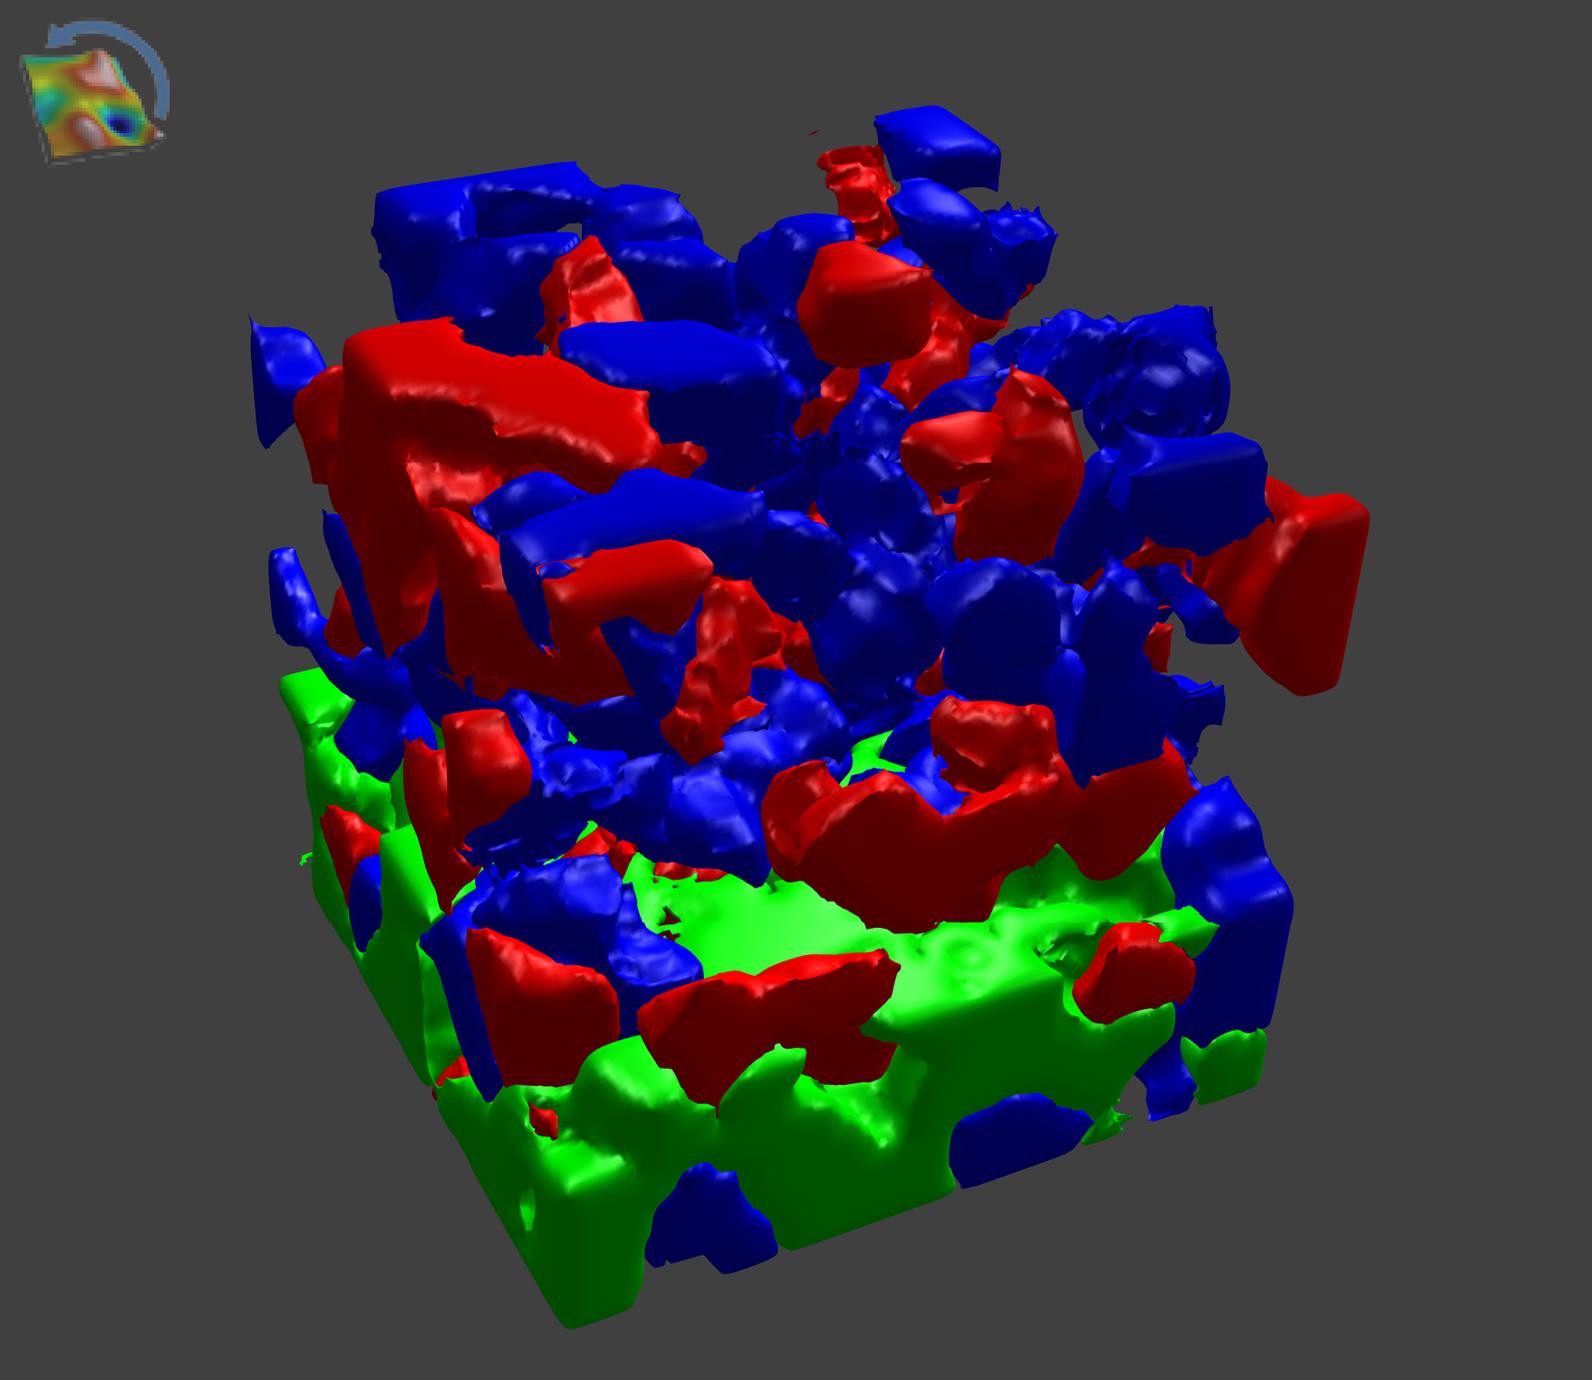
FIB-SEM cubes: manage image stacks more easily
- FIB-SEM: open image stacks directly as 3D voxel cubes using Load a Multi-Channel Cube option
- Invert stack and intensity
- Use new Extract area Operator on cubes to focus on zone of interest and manipulate cube more quickly
- Get cube ready for further analysis with new pre-processing tools:
- Scale the image (correct XY and Z axes)
- Shift
- Spatial filter (reduce noise)
- Correct variations in intensity
New features for SPM
Parameter maps on force curve data
- Parameter map on Force curves
- Access this feature more easily via the workflow and recall it to make changes
- Export Parameter Maps separately
- Create Multi-channel image studiables and overlay them on topography in 3D for publications
- See it in action in our webinar (in French): Traitement et analyse des courbes de force avec MountainsSPIP®
Fiber analysis now accessible for SPM users
- SPM fiber analysis including:
- Thresholding
- Average fiber diameter calculation
- Generation of statistics
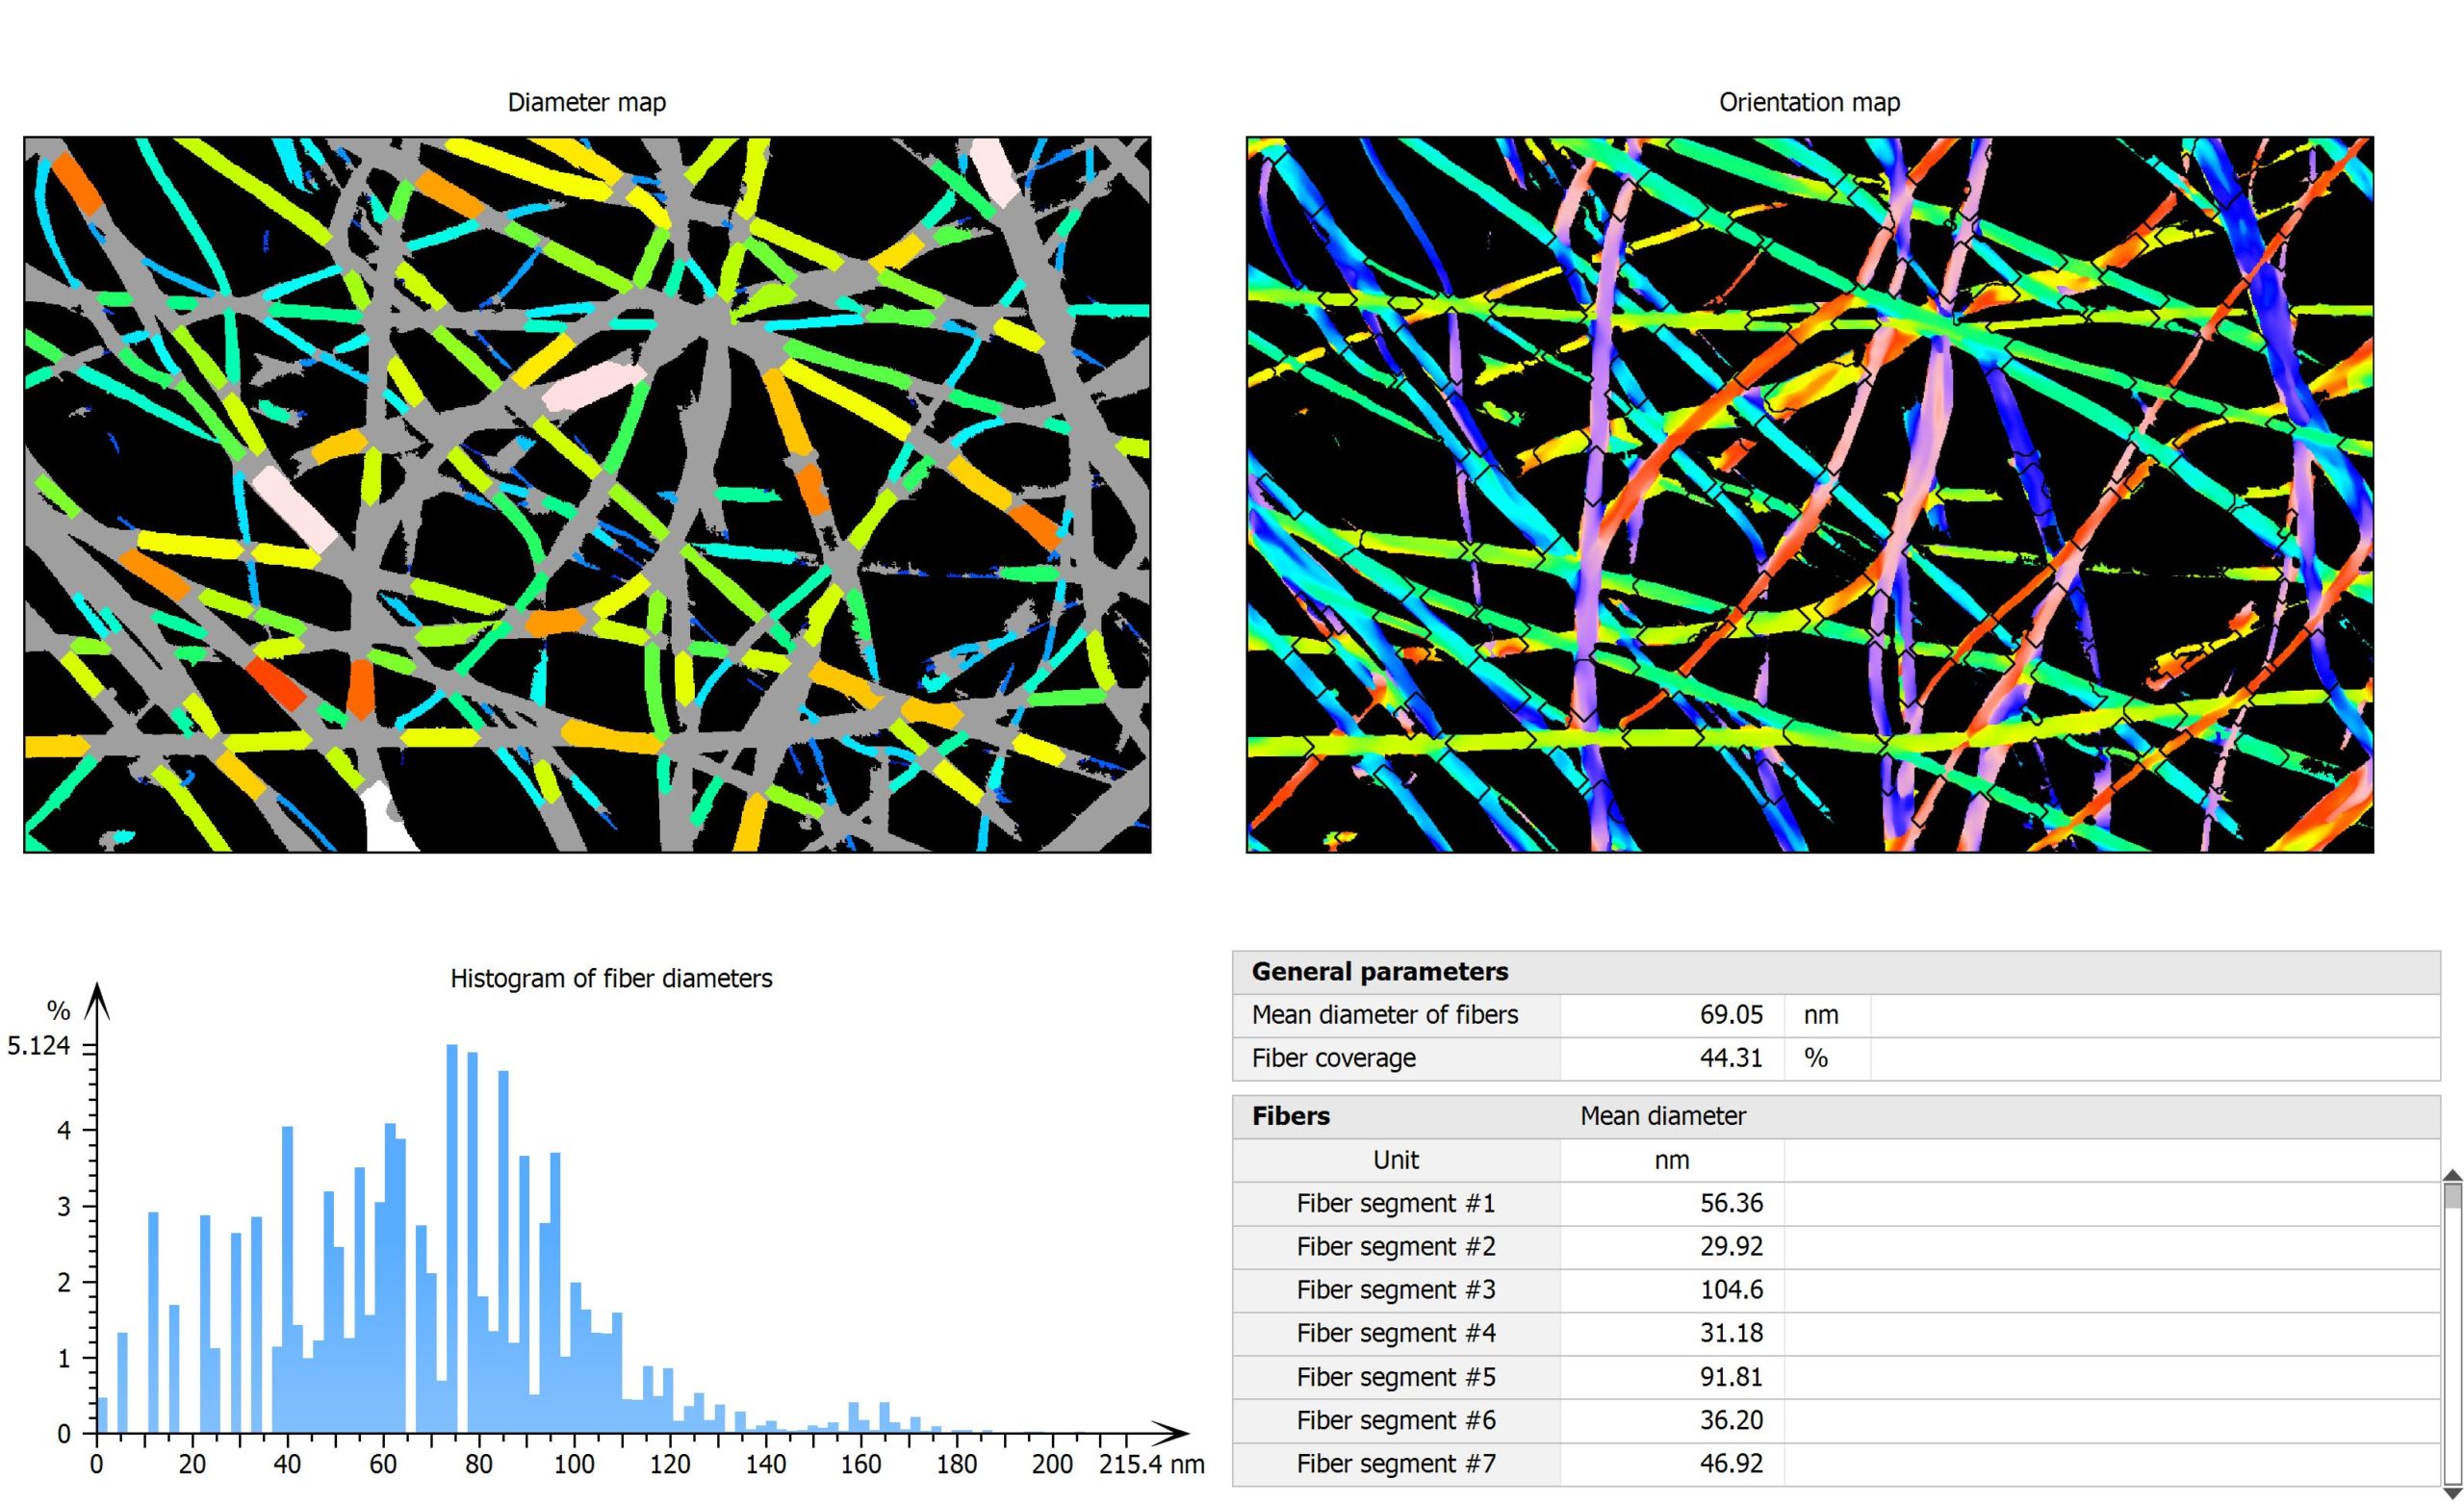
Above. Fiber Analysis in Mountains®: diameter map, orientation map, histogram & interactive parameters table.
New product for light microscopy
MountainsImage®, lighting up your image analysis
- New product family in version 10:
- serving light microscopy users and/or
- for the study of any B&W or color image (without topography) obtained using a camera or imaging system
- 3 new products in the MountainsImage® range
- MountainsImage® Starter: load and visualize images from light microscopes
- MountainsImage® Expert: analyze images, including Contour Analysis
- MountainsImage® Premium: advanced analysis of images, including Particle Analysis, Fiber Analysis and Contour Analysis
Above. Visualization of RGB chrominance using the “Convert to monochrome image” Operator
Features available for processing images from light microscopy include:
- Get images ready for analysis: display in true color or pseudo-color, enhance and optimize
- Perform manual measurements (distances, angles etc.)
- Generate luminance histograms
- Carry out Slices analysis (thresholding)
- Invert colors/luminance
- Convert to monochrome image (work with luminance, RGB channels, RGB chrominance or optimal contrast)
- Scale images, mirror, spatial filter, texture isotropy
- Threshold luminance (Expand histogram, B&W etc.)
- Copy/paste images into Mountains® as illustrations (bitmap), vectors or image studiables
- Fiber Analysis and Particle Analysis
- Detect and quantify individual fibers and particles, create classifications and generate statistics
- Show image (or surface) beneath contour: Adjust transparency & color palette
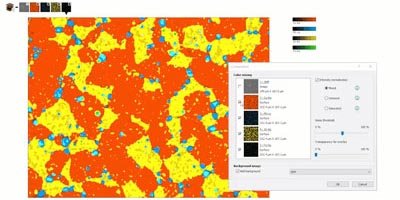
- Color segmentation (via Particle Analysis)
- Isolate zones based on color
- Define number of components to detect & visualize coverage (allows wear applications on images w/out topography)
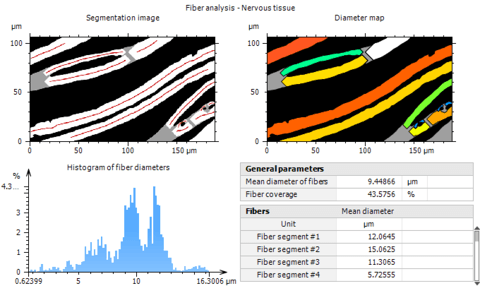
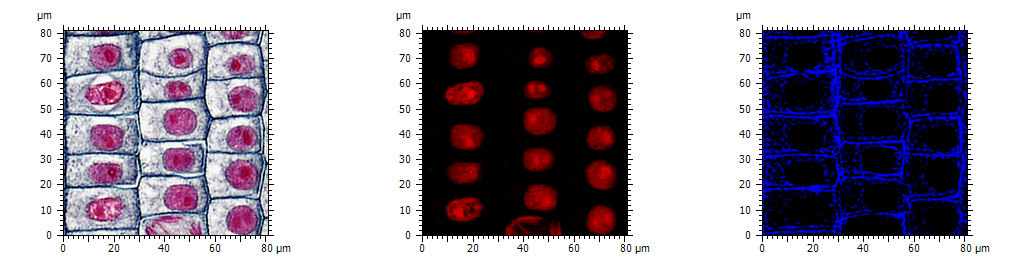
Above left. Fiber Analysis. – Above right. Image beneath Contour
How to update
A full list of the changes and bug fixes published in this release is available in the release notes.
Access to this latest release is included in the Mountains® Software Maintenance Plan (SMP). Please visit our Software Updates page.
To find out more about SMP options, please contact sales@digitalsurf.revelateur.fr or visit this page.