With the end of SPIP™ maintenance and support announced for the end of 2020, Dr Dalia Yablon, founder of SurfaceChar LLC and longtime SPIP™ user, shares her experience on transitioning to MountainsSPIP® for AFM image processing and analysis.

I have been an SPIP™ Image Metrology user since 2003 and quickly became a fan for all of its capabilities including more advanced functionality like particle analysis and force curves that were applicable to all AFM images, regardless of instrument vendor.
So I was curious to see what the differences would be with MountainsSPIP® as I transitioned earlier this year. While the organization, nomenclature, and design of the MountainsSPIP® software is markedly different than SPIP™, I was very pleased to see that the performance and functionality matched and even exceeded SPIP™’s capabilities in several important areas.
An interactive workflow
One of the most important differentiators in MountainsSPIP® over all other software packages I am familiar with, is the ability to save your workflow for future use and modification. For example, figure 1a below shows a 2D representation of some AFM data. With a 3-step workflow, we can create the corresponding 3D image in figure 1b, where the phase is overlaid onto the topography.
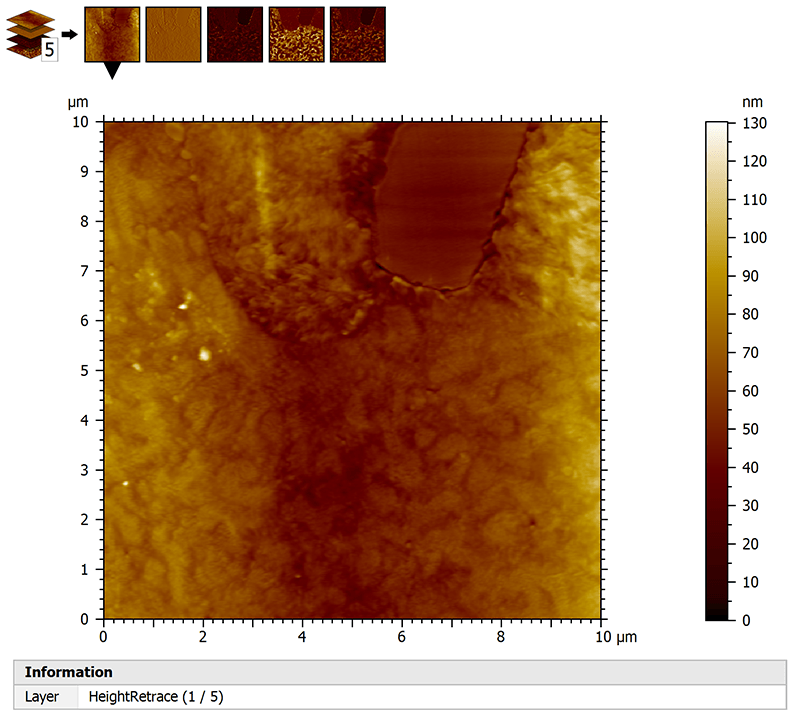
Figure 1a. Multi-channel AFM data (displayed in 2D), including phase and topography channels.
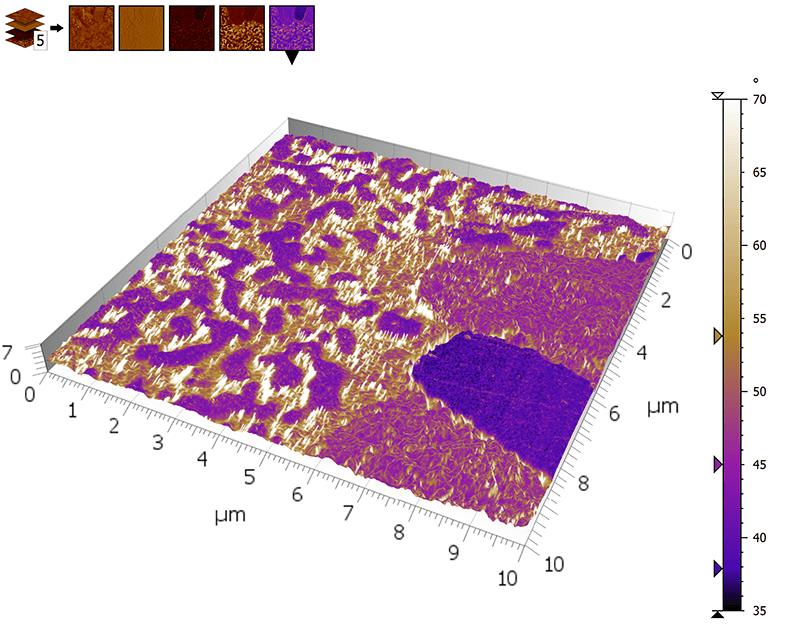
Figure 1b. 3D view of multi-channel surface.
With a saved workflow, the user can recall this workflow and go in and adjust individual steps to see what effect they may have without having to redo the entire sequence. This ability is also very instructional for other users: they can see exactly how the image was processed and analyzed without having to take screenshots and explanations. Finally, MountainsSPIP® enables the user to substitute a different image into a given workflow, so that it can be widely applied.
Powerful Cross-sectional analysis
Generally, MountainsSPIP® offers advanced, powerful capability in all traditional AFM image processing steps that go beyond the conventional capabilities. For example, cross-sectional analysis is a standard tool offered by most image processing software to draw a cross-sectional profile across the image and measure the distance between two points.
But MountainsSPIP®’s capability of cross-sectional profiling is far more powerful as shown in Figure 2a below: one can draw a cross-section profile in any direction including circles, zig-zags, or those that cut through the highest or lowest point (calculated by the software). The software allows up to 5 cursors simultaneously where a number of parameters can be calculated beyond just difference in x and z as shown in Figure 2b.
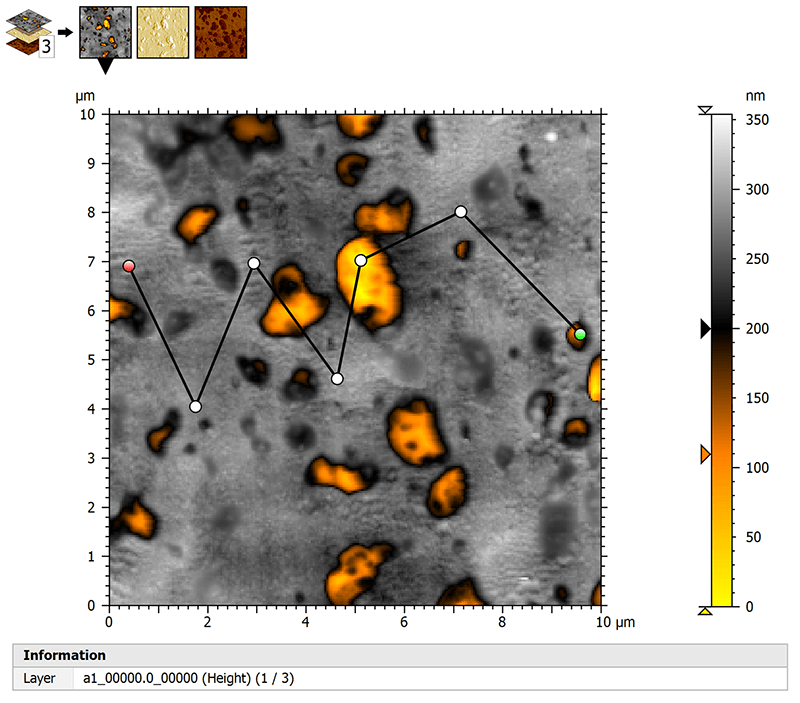
Figure 2a. Cross-section profile shown on the surface.
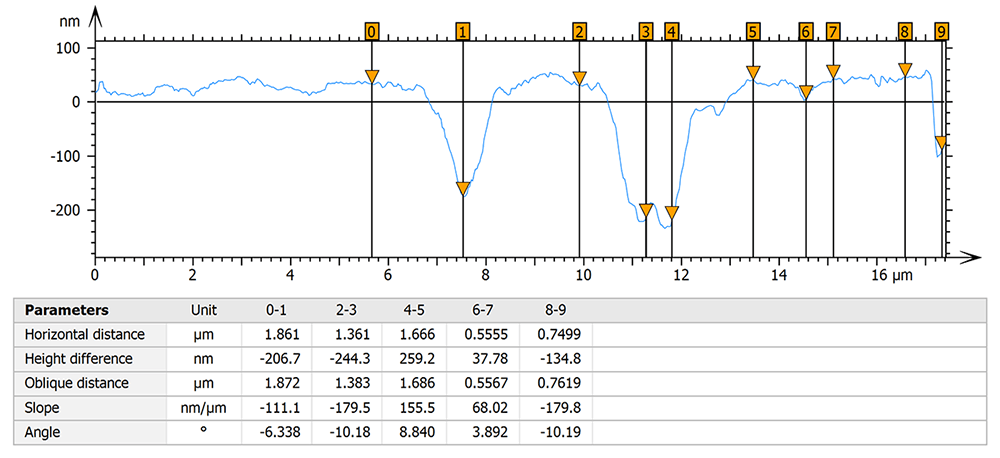
Figure 2b. Extraction of a cross-section profile. Height difference, slope, angle and horizontal & oblique distances were calculated.
Unique particle analysis functionalities
Another example of MountainsSPIP® capability lies in the important area of particle detection. All of the conventional options for threshold detection including watershed and edge detection, as well as the ability to merge or split particles are included.
But keeping with its tradition of offering more advances, MountainsSPIP® has unique functionalities involving particle classification and visualization that emphasizes ease-of-use, together with the ability to calculate dozens of parameters on particles that we are accustomed with SPIP™.
In Figure 3 below, I have created three customized categories based on particle diameter to highlight the various features on the surface. In addition, I have calculated spherical caps for those particles that include them (marked by circles on individual particles) where the radius is calculated as well.
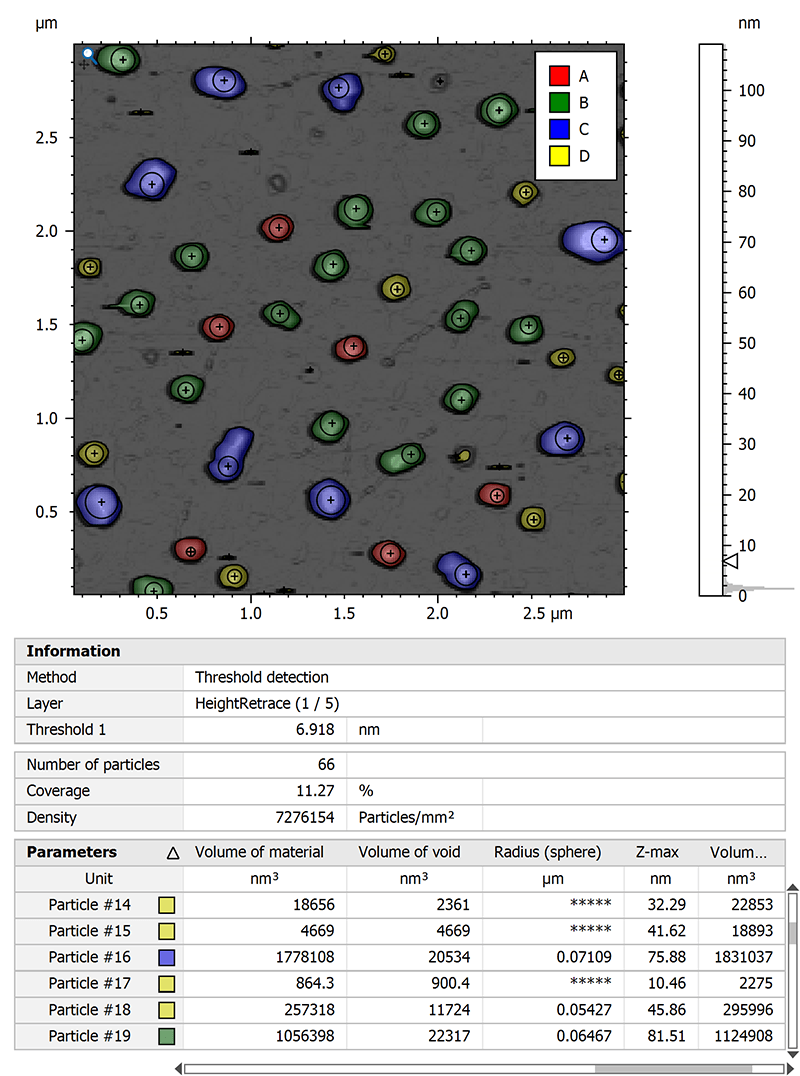
Figure 3. Particle analysis study of three different particle varieties.
Conclusion
While there is a learning curve with MountainsSPIP®, it is well worth the investment, and one will be rewarded with more advanced and powerful image processing and analysis that crosses all vendor platforms.
To access more information about MountainsSPIP® software and how to upgrade, please read the following page.
How to switch from SPIP™ to MountainsSPIP®
