Particle analysis is used in research and industry across many fields ranging from quality control of structured materials (metal, alloys, etc.) to characterization of nano-structure assemblies. Data is typically collected using profilometry or microscopy, in particular scanning probe microscopy (SPM) including atomic force microscopy (AFM).
Mountains® analysis software provides several feature detection methods, a range of graphical representations, classification and statistical tools for performing particle analysis, pore analysis or grain analysis. Product manager for SPM applications at Digital Surf, Mathieu Cognard, tells us more.

The Particle analysis study is used to detect, quantify and classify particles, pores, grains and other image features (of any shape and size) that have boundaries.
Preparing the surface before detection
First of all, good knowledge of the sample studied is primordial in order to determine the features to study (particles, pores, skeleton etc.) This will help you choose the right detection method and options.
Leveling the surface is also necessary in order to obtain a flat and horizontal background, especially if you are going to use the Threshold detection method. Remove noise and filter the surface if necessary.
Access to the tools and display options
The Particle analysis tools can be found in the Studies tab when your surface studiable is active. Clicking on the icon will produce a new Study in the Document.

By default, the tables of Individual Results and Global statistics are shown below the image of the detected layer. However, they can also be displayed to the right of the panel to enhance visualization. Just right-click on the table and select Show results on the right side. To save this setting as default, you can press Alt+S. Press F11 for full screen-mode.
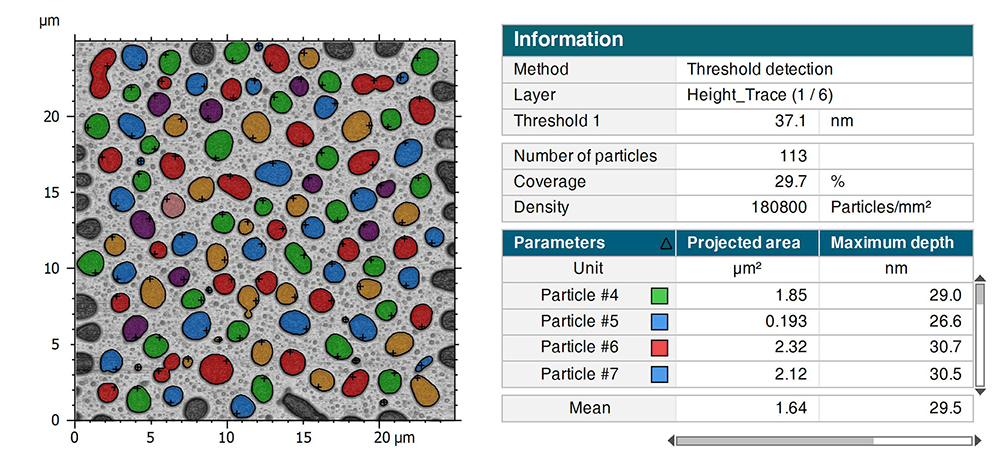
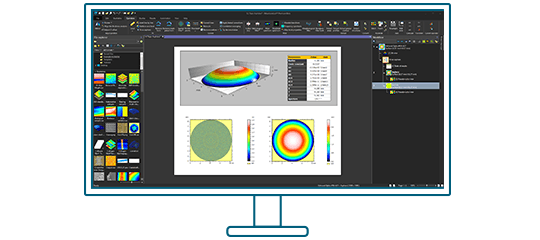
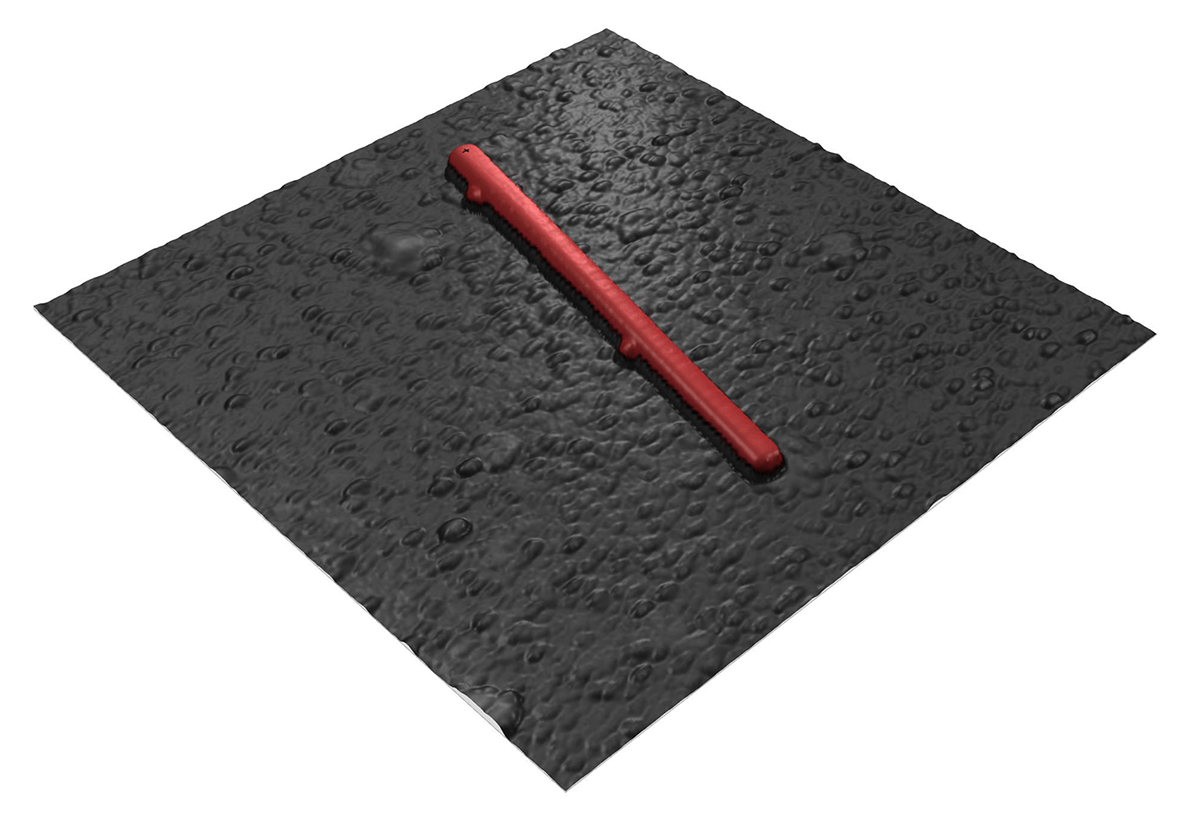
Above. View of the Particle analysis study
Particle detection
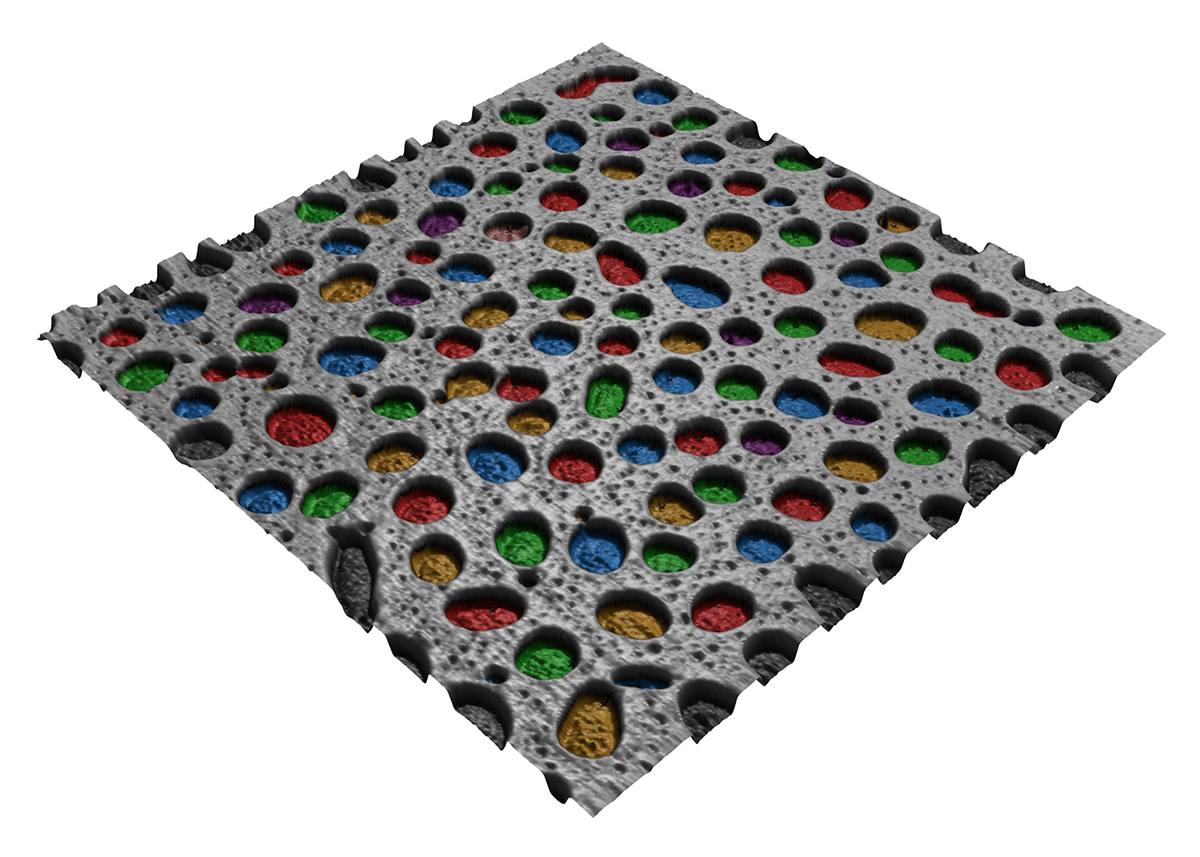
Threshold detection
This is a fast and efficient method for detecting particles or pores that stand out clearly on a flat background, using one or two thresholds. Surface roughness must be smaller than the height of the particles (or smaller than the depth of the pores).
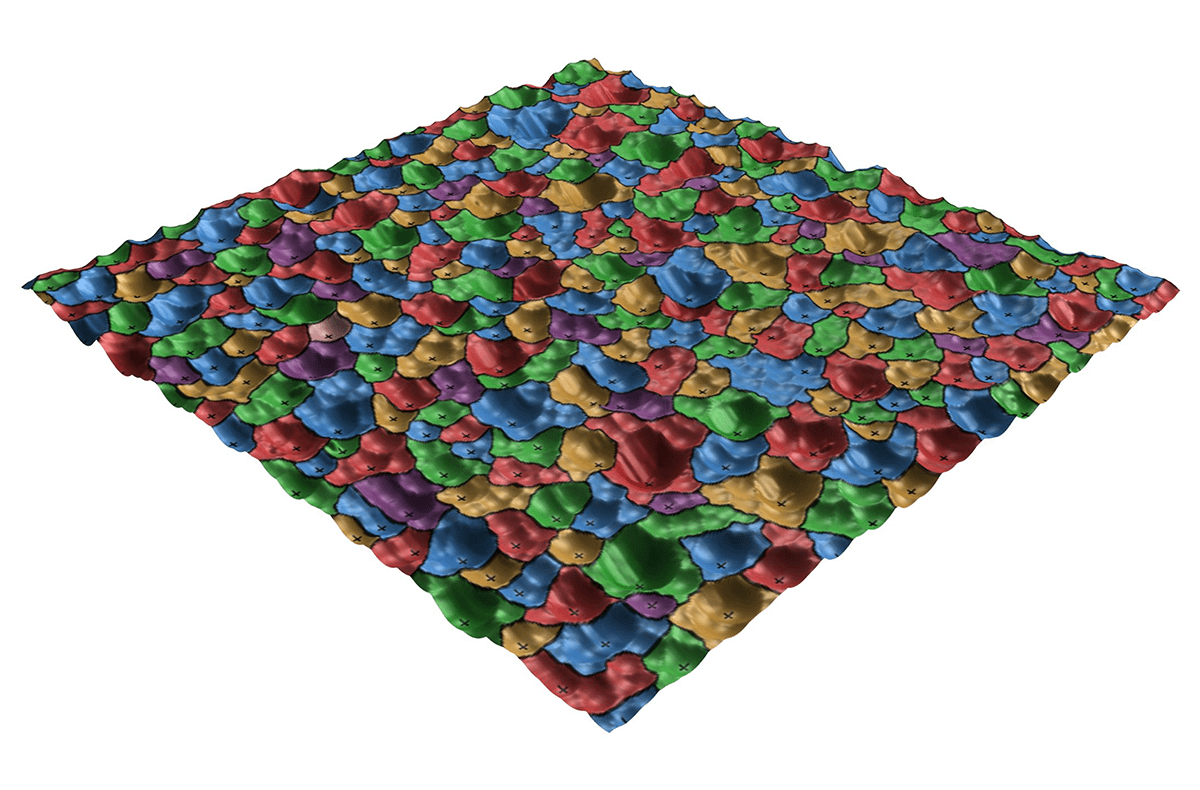
Watershed detection
Detect contiguous dale or hills motifs using watershed segmentation as defined in ISO25178-2 and fully segment the surface. The algorithm calculates watersheds that divide or partition hill or dale motifs and locates their peaks and pits. Pre-processing filters and pruning criteria allow you to reduce noise and eliminate insignificant motifs by merging them into larger ones.
Edge detection
Detect features on an uneven background, using watershed segmentation after the application of an edge detection filter. This method can also be used if the features are connected or not clearly separated. It also works for detecting grain boundaries of polished metal or ceramic surfaces.
Detection and calculation channels
For simple topographic surfaces, particle detection and parameter calculation is performed on the same data in metric units.
For multichannel Studiables, or multilayer data generated with a scanning probe microscope or atomic force microscope, it is possible to differentiate the detection and calculation channels. For instance, you can detect particles on a topographic layer and calculate your parameters on a channel with another unit (amplitude, phase, stiffness…) This allows you to optimize the accuracy of your analyses.
Particle classification
Mountains® also offers a powerful tool called “Particle classification”. This tool can create several classes defined by one or several criteria. Indeed, particles can be classified according to their specific characteristics, i.e. a parameter calculated in the study.
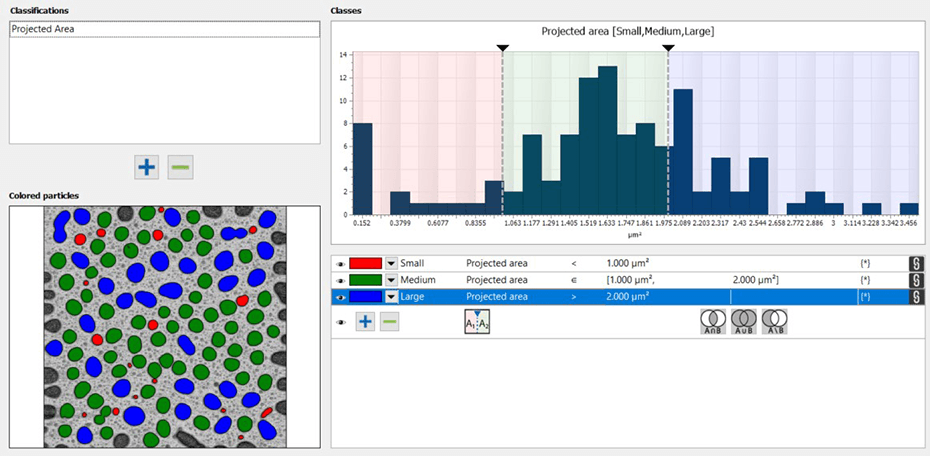
Above. Particles can be classified based on multiple criteria.
The creation of classes leads to the creation of a new table of results called “Statistics by class”. This table combines the parameters calculated individually on each particle into statistical parameters divided into classes.

Aggregation
Within a single document, you can perform multiple particle analyses on similar samples. It is then possible to aggregate the obtained results and visualize them as a whole in various graphical forms (histogram, control chart, box plot…)

Above. Histograms allow user to aggregate data from multiple populations.
Advanced statistics on large populations
If you have a large population of similar studiables, we recommend that you prepare a template to be applied to the entire population via a statistical document.
This document allows you to automate your analysis procedures while allowing the creation of adapted statistical studies. It is then possible to visualize the impact of each studiable on the final results.

Above. Control chart showing all individual results from aggregated populations.
To learn more about Particle analysis and classification, watch the dedicated webinar.
Would you like to perform Particle Analysis on your own data?
Try Mountains® surface analysis software for free