The Abbott curve study in Mountains® allows users to display statistical information about height values, using two different graphs: the histogram and the Abbott-Firestone curve. Mountains® 9 sees a considerable number of improvements to this tool, useful to both profilometry and scanning probe microscopy users. Isabelle Cauwet, in charge of Applications & Methods at Digital Surf, explains more.
The first graph is the Height (or depth) distribution, displayed as an Histogram, which gives the probability (frequency) for points to be at a given height (depth). A bin of the histogram is defined by its width (height or depth interval) and its frequency.
The second graph is the Abbott-Firestone curve, which displays the material ratio in function of the Height. The material ratio is the percentage of the surface above a given height. The Abbott-Firestone curve is the cumulative curve of the distribution.
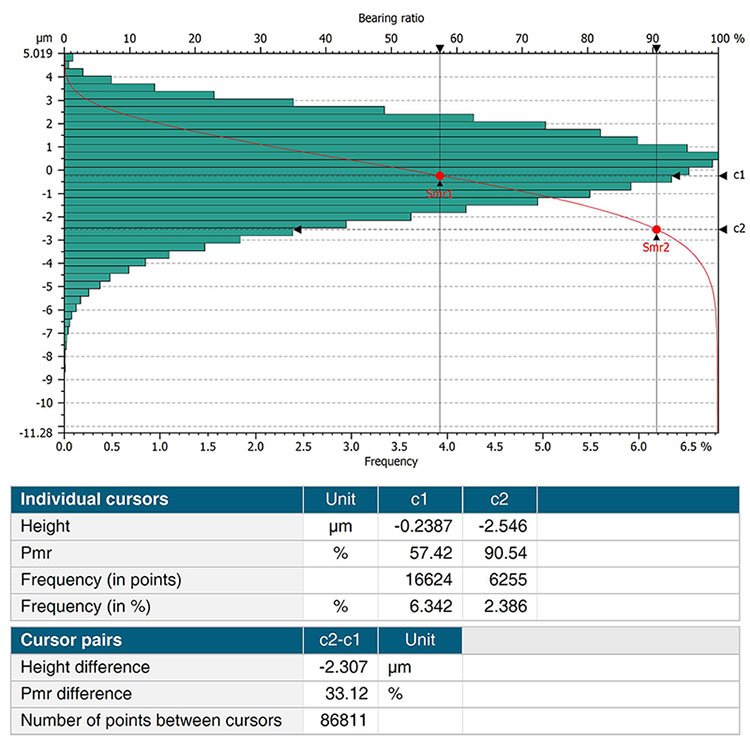
Above. Visualization of Smr points
The Abbott-Firestone curve is widely used in profilometry for predicting functional behaviors of mechanical components. For example, the shape of the curve can be correlated to functional properties such as sealing or lubrication.
On the contrary, the SPM community does not use the Abbott-Firestone curve, but is familiar with height histogram, for example to display information about particle height, atomic planes or flatness of a chemical deposit.
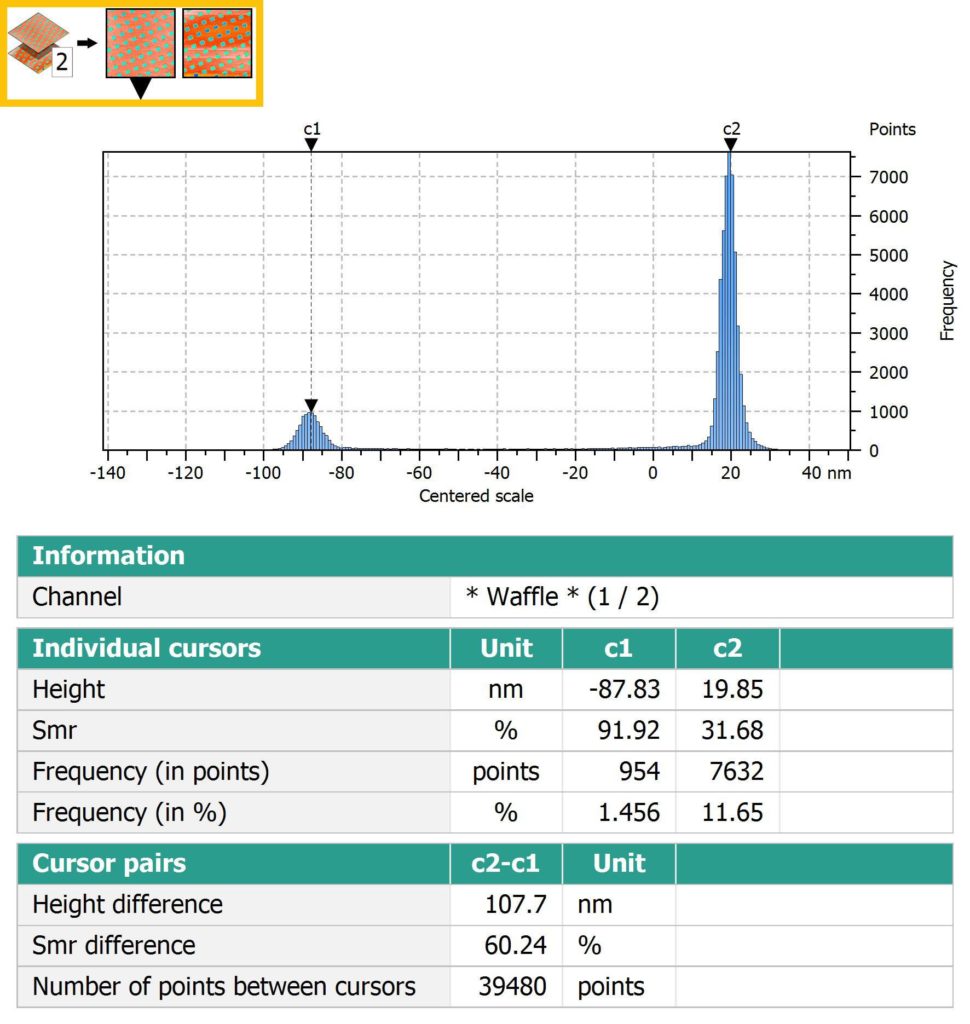
Above. Switch between histograms in interactive mode when working with multichannel data such as AFM images.
Improved usability and new features
Version 9 introduces new features to the study. It is now possible to zoom in on the graph to reveal details, users can automatically set the number of bins or visualize the Smr parameter (areal material ratio) on the curve.
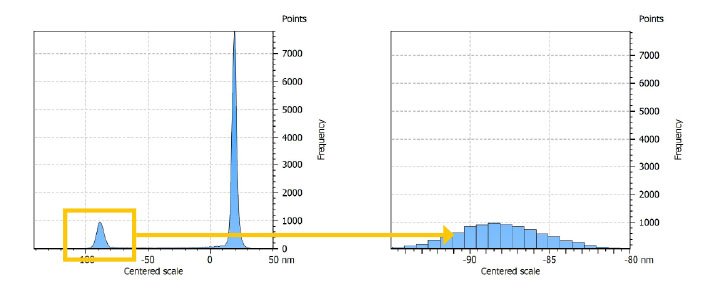
Above. Zoom in on a portion of the histogram to see details
SPM users will appreciate being able to have the histogram displayed horizontally (whereas in profilometry, the height axis is vertical) and the interactive feature for use when working with multichannel studiables.
All users will benefit from the automatic step height calculation from the histogram peaks, the display of individual bin values and the ability to show bin frequencies in number of points instead of percent.
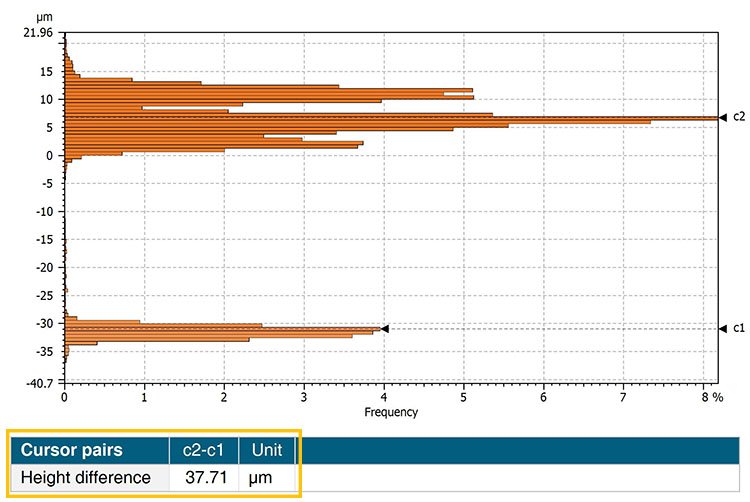
Above. Automatically calculate height difference from histogram peaks
Two predefined buttons for the same study
Two different buttons are now displayed in the Studies ribbon: “Abbott curve” and “Histogram analysis”.
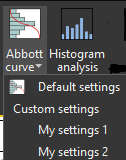
The availability of each tool depends on the product level.
Both buttons generate the same study, but the result is configured differently: the Abbott curve is displayed with a vertical height axis, the Histogram with a horizontal height axis.
As usual in Mountains®, settings can be customized and saved for later use: this means you can save and re-apply your own customized settings (color, displayed parameters, bin direction, imposed scale etc.) and save time when performing the same kind of analysis subsequently.
At Digital Surf, we are keen to continuously improve our products in particular by taking into account user needs and requests. It is also important to us to maintain the architecture integrity of the software and ease-of-use of the user interface, for the benefit of users in all our application fields.
See it in action
The new Abbott curve and Histogram features are presented in our webinar on Mountains® 9.
Now available to watch on-demand here.