Researchers at the Structural Nanomechanics Lab at Dalhousie University in Canada have been investigating the nanomechanical behavior of Collagen I fibrils. Their study demonstrated that nanomechanical mapping can detect subtle changes in molecular dynamics and fibril architecture. Using data acquired by Kelsey Gsell (PhD Student in Biomedical Engineering), this article explains how Mountains® software allows fine-tuning and detailed analysis of force volume data.
Collagen is the primary protein component that provides structural integrity to mammalian tissues. It provides mechanical strength to tissues such as bone, tendon, ligament and skin. In this article, the studiable used was a force volume image of a collagen fibril from a rat tail acquired on a glass substrate. Mechanical data analysis was required to be performed on the collagen fiber only, in order to obtain meaningful results.
The raw data was therefore processed with the goal of extracting only the collagen fibril useful for the study. To do this, an initial step of indentation analysis was performed on the entire mapping (figure 1). The Sneddon model was used by fitting the force curves to an indentation depth of 25% of the zero-force height of the fibril. This ensured the influence of the underlying glass substrate on the calculated moduli was minimized.

Figure 1. Indentation analysis (Sneddon) was performed to isolate a specific region of the collagen I fibril.
Advanced tools for sorting force curves
The new MountainsSPIP® “Sort by a parameter” operator was then applied in order to display force curves with a Young’s modulus lower than 35MPa, allowing researchers to focus their study solely on the fibril.
Sorting force curves using parameters
A surface analyzed by force spectroscopy can be composed of heterogeneous elements. It is necessary to separate these components using a differentiating physical parameter (i.e. Young’s modulus, adhesion energy …) The ‘Sort by a parameter’ operator allows you to select a physical parameter and to sort data accordingly. It is possible to generate a new sorted studiable as well as residual force curves.
Statistics were generated on these specific areas of interest. The 3D view on figure 2 shows the distribution of the elastic moduli along the collagen fibril overlaid on the measured topography. Two interesting features were observed here: the fibril ends and the sharp bends exhibiting moduli lower than their surroundings.
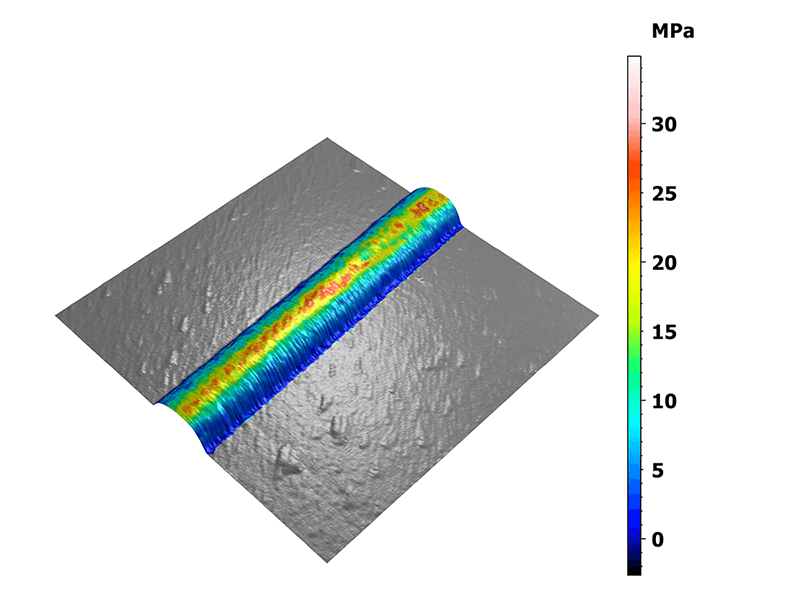
Figure 2. Mapping of the Young’s modulus overlaid on the three-dimensional topography.
Calculation of deformation energies
MountainsSPIP® software also allows for the calculation of the deformation energies used during the measurement. Thus, the total deformation, elastic and plastic energies were studied in order to understand the mechanical behavior of the collagen fiber under different constraints (figure 3).
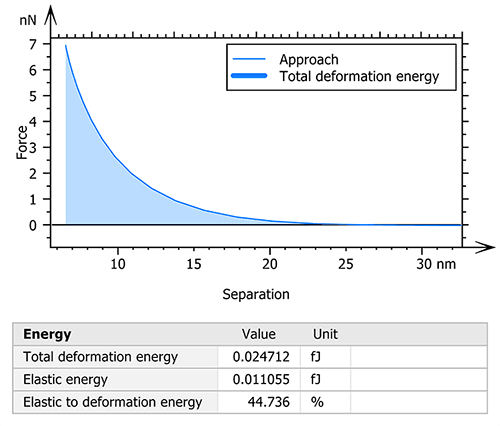
Figure 3. Calculation and visualization of the total deformation energy.
In this case, the nanomechanical behavior was analyzed on the untreated collagen I fibril and the measurement was then performed in a buffer solution. The 3D view in figure 4 highlights the ratio between the elastic behavior of the fibril and its total deformation. Here, a precise statistical study of the reversible deformation was made possible by the previous sorting step, highlighting the collagen fiber without taking into account the underlying substrate.
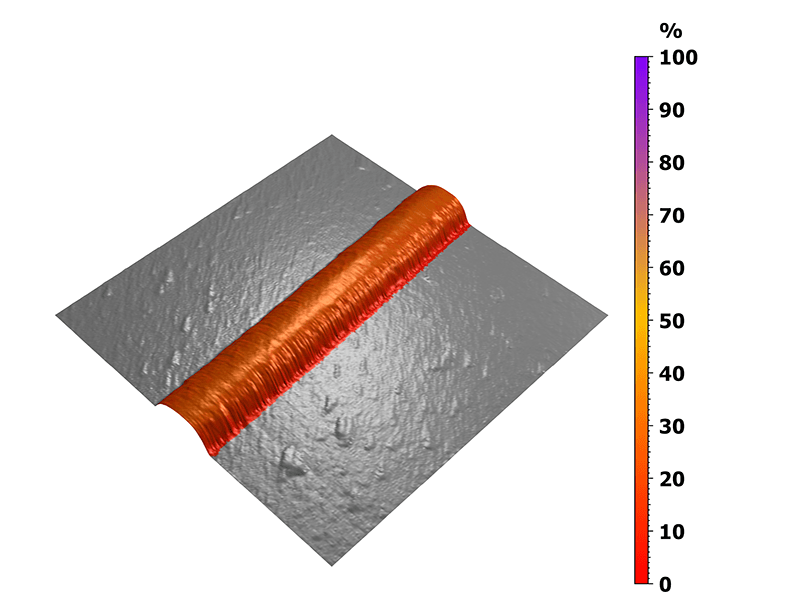
Figure 4. Mapping of the elastic to total deformation ratio.
Conclusion
Using MountainsSPIP® software (version 9.1), it is possible to perform accurate and detailed force curve analyses. The sorting operators can be used to highlight areas of interest using precise mechanical parameters. In this study, the mappings obtained with the software allowed the demonstration of the viscoelastic nature of the collagen fibrils at the nanoscale.
Read More
Nanomechanical Mapping of Hydrated Rat Tail Tendon Collagen I Fibrils. Samuel J. Baldwin, Andrew S. Quigley, Charlotte Clegg, and Laurent Kreplak from the Department of Physics and Atmospheric Science, Dalhousie University, Halifax, Canada. In: doi.org/10.1016/j.bpj.2014.09.003
Instruments and software used
BioScope Catalyst atomic force microscope from Bruker mounted on a IX71 inverted microscope from Olympus + MountainsSPIP® software.