Many scanning probe microscopes can image several interactions simultaneously. Through their different modes, SPMs produce multiple datasets at the same location on the sample. For some applications, it can be meaningful to combine and correlate the information coming from these different channels. MountainsSPIP® 8 offers many tools for efficiently performing this comparison. Let’s take a closer look, with Isabelle Cauwet, Digital Surf applications specialist.
“MULTI-CHANNEL” IMAGE PROCESSING MADE SIMPLE
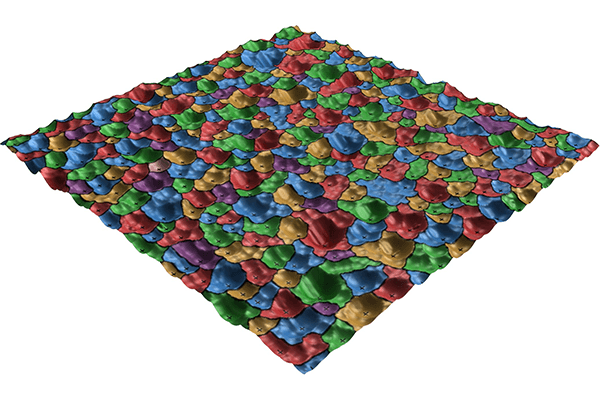
Some microscopes generate more than one value for each pixel. One of these “channels” is often topography, i.e. a map of Z heights. However, in scanning probe microscopy (AFM, STM etc.), it is common to obtain other values, such as conductivity or stiffness, which are central for understanding sample properties. MountainsSPIP® 8 allows users to handle multi-channel images as easily and as efficiently as if they were dealing with a simple topography image.
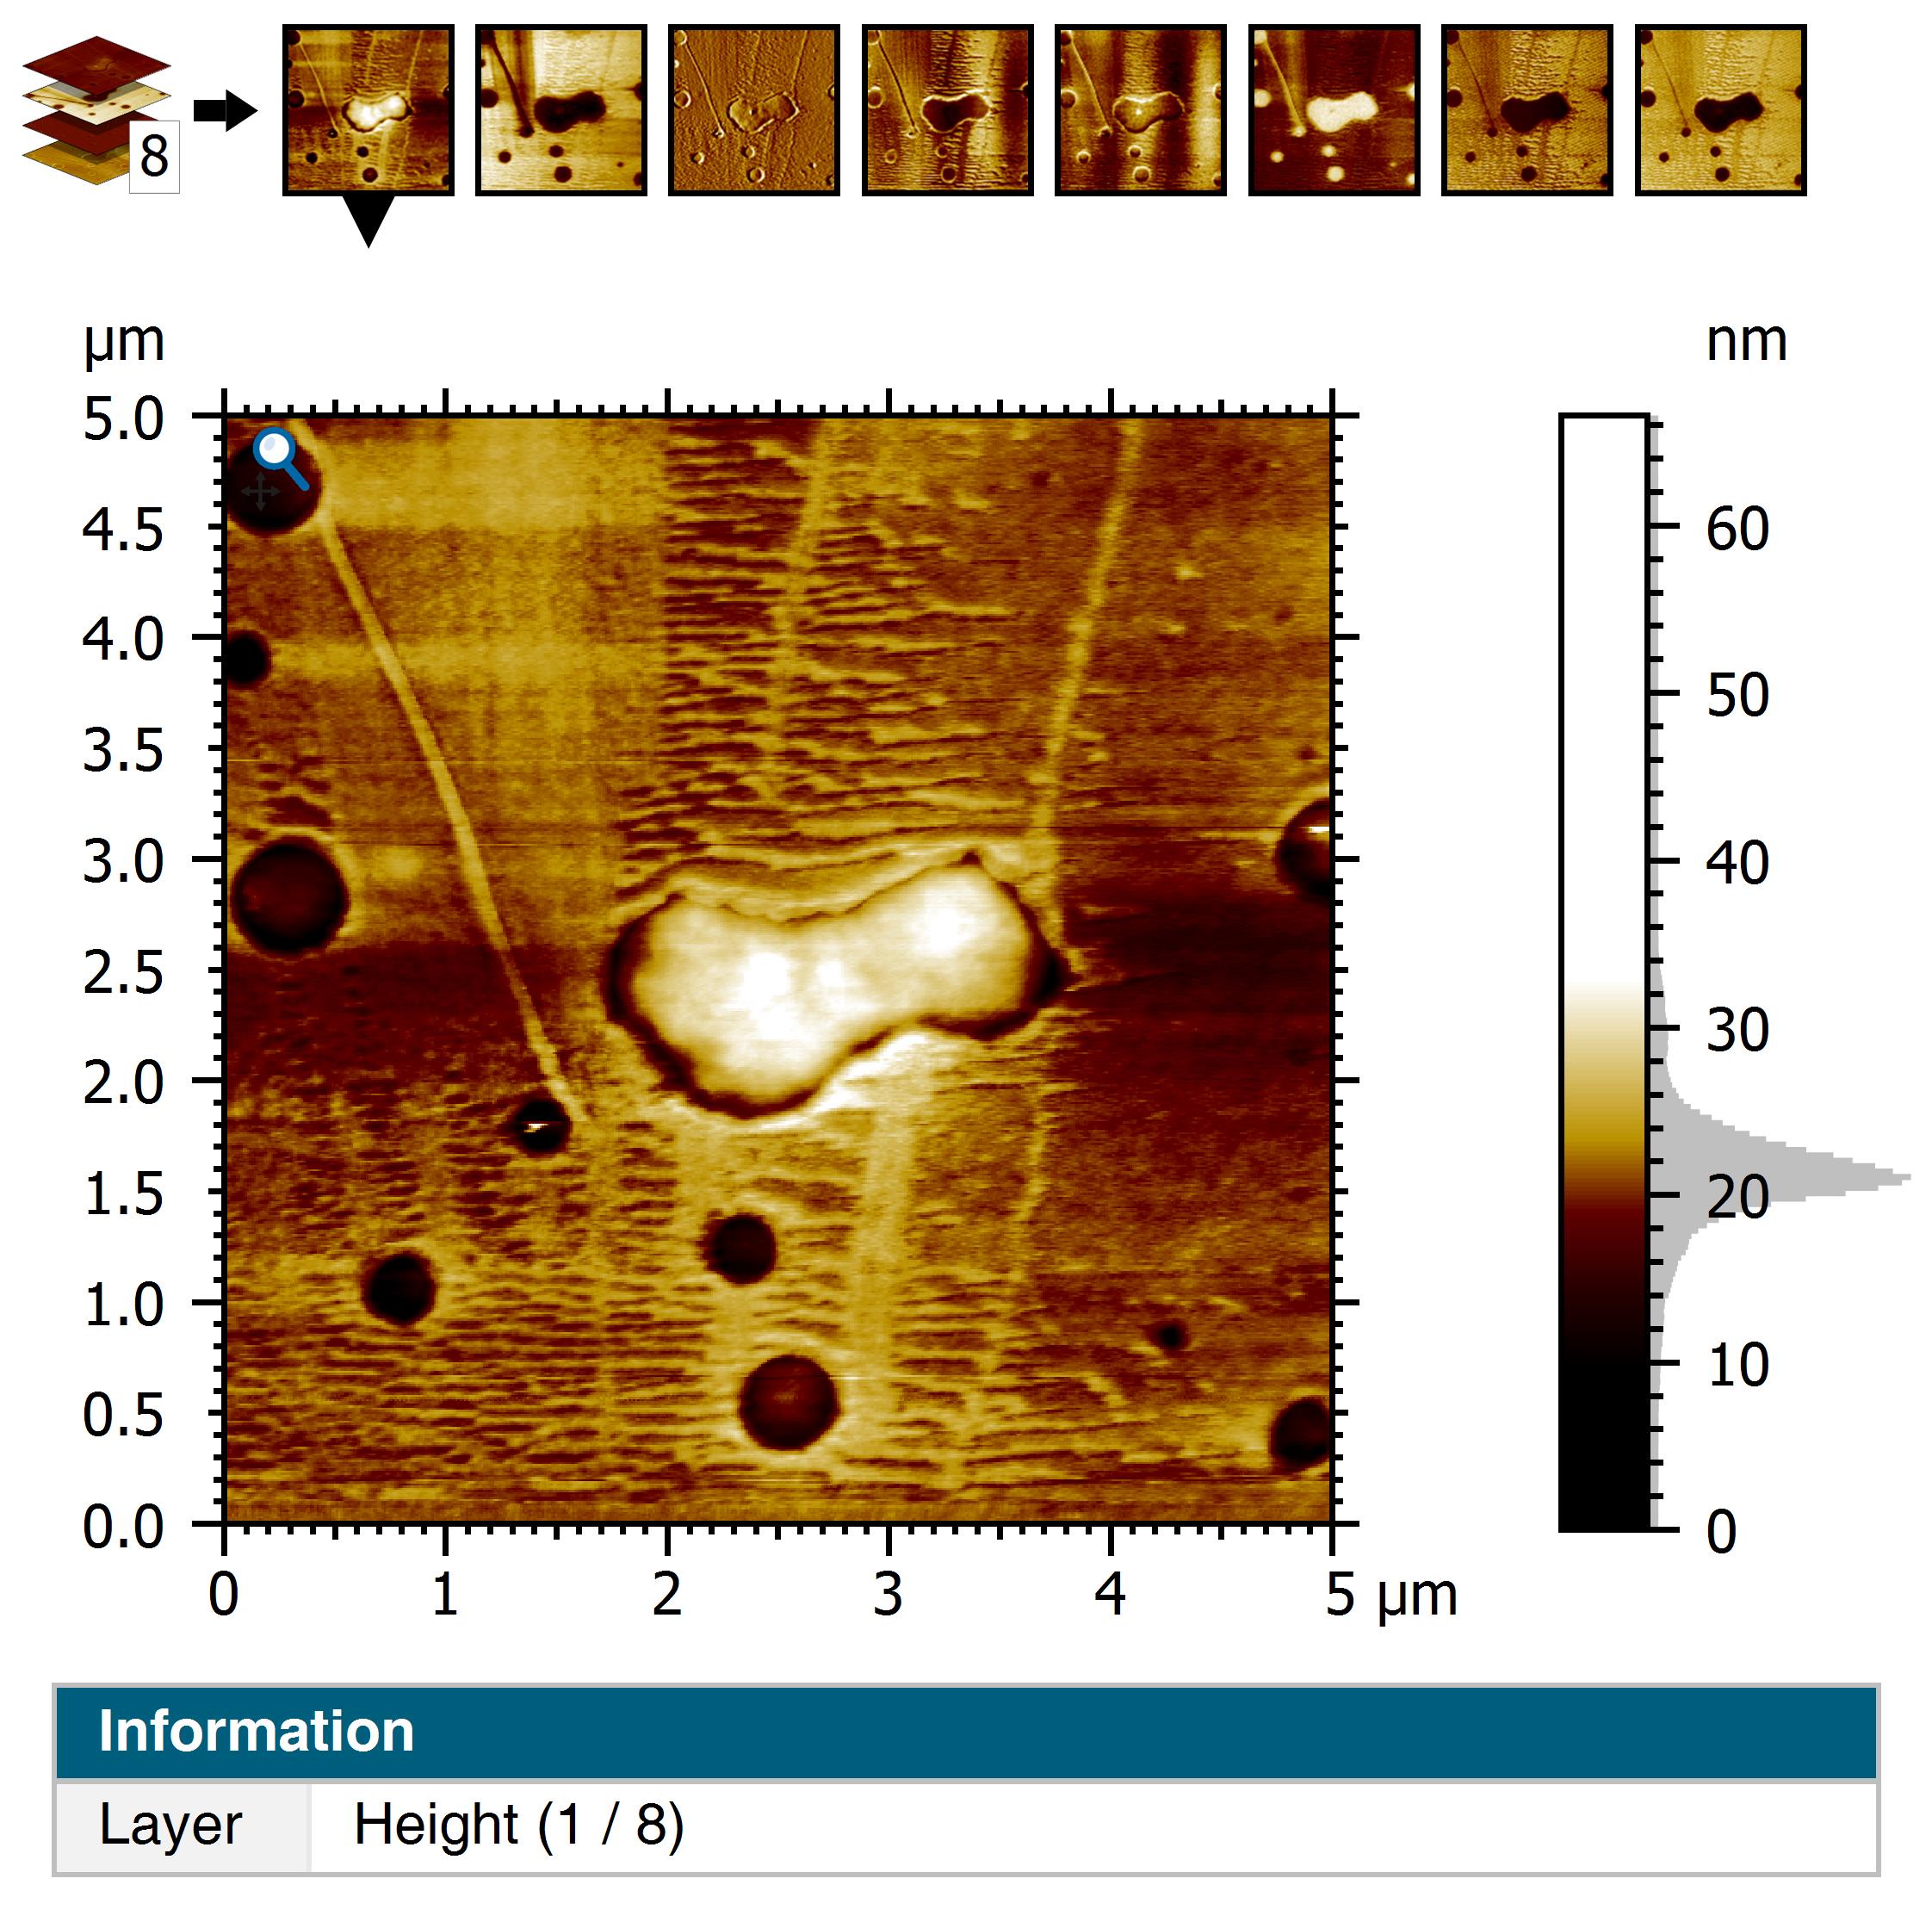
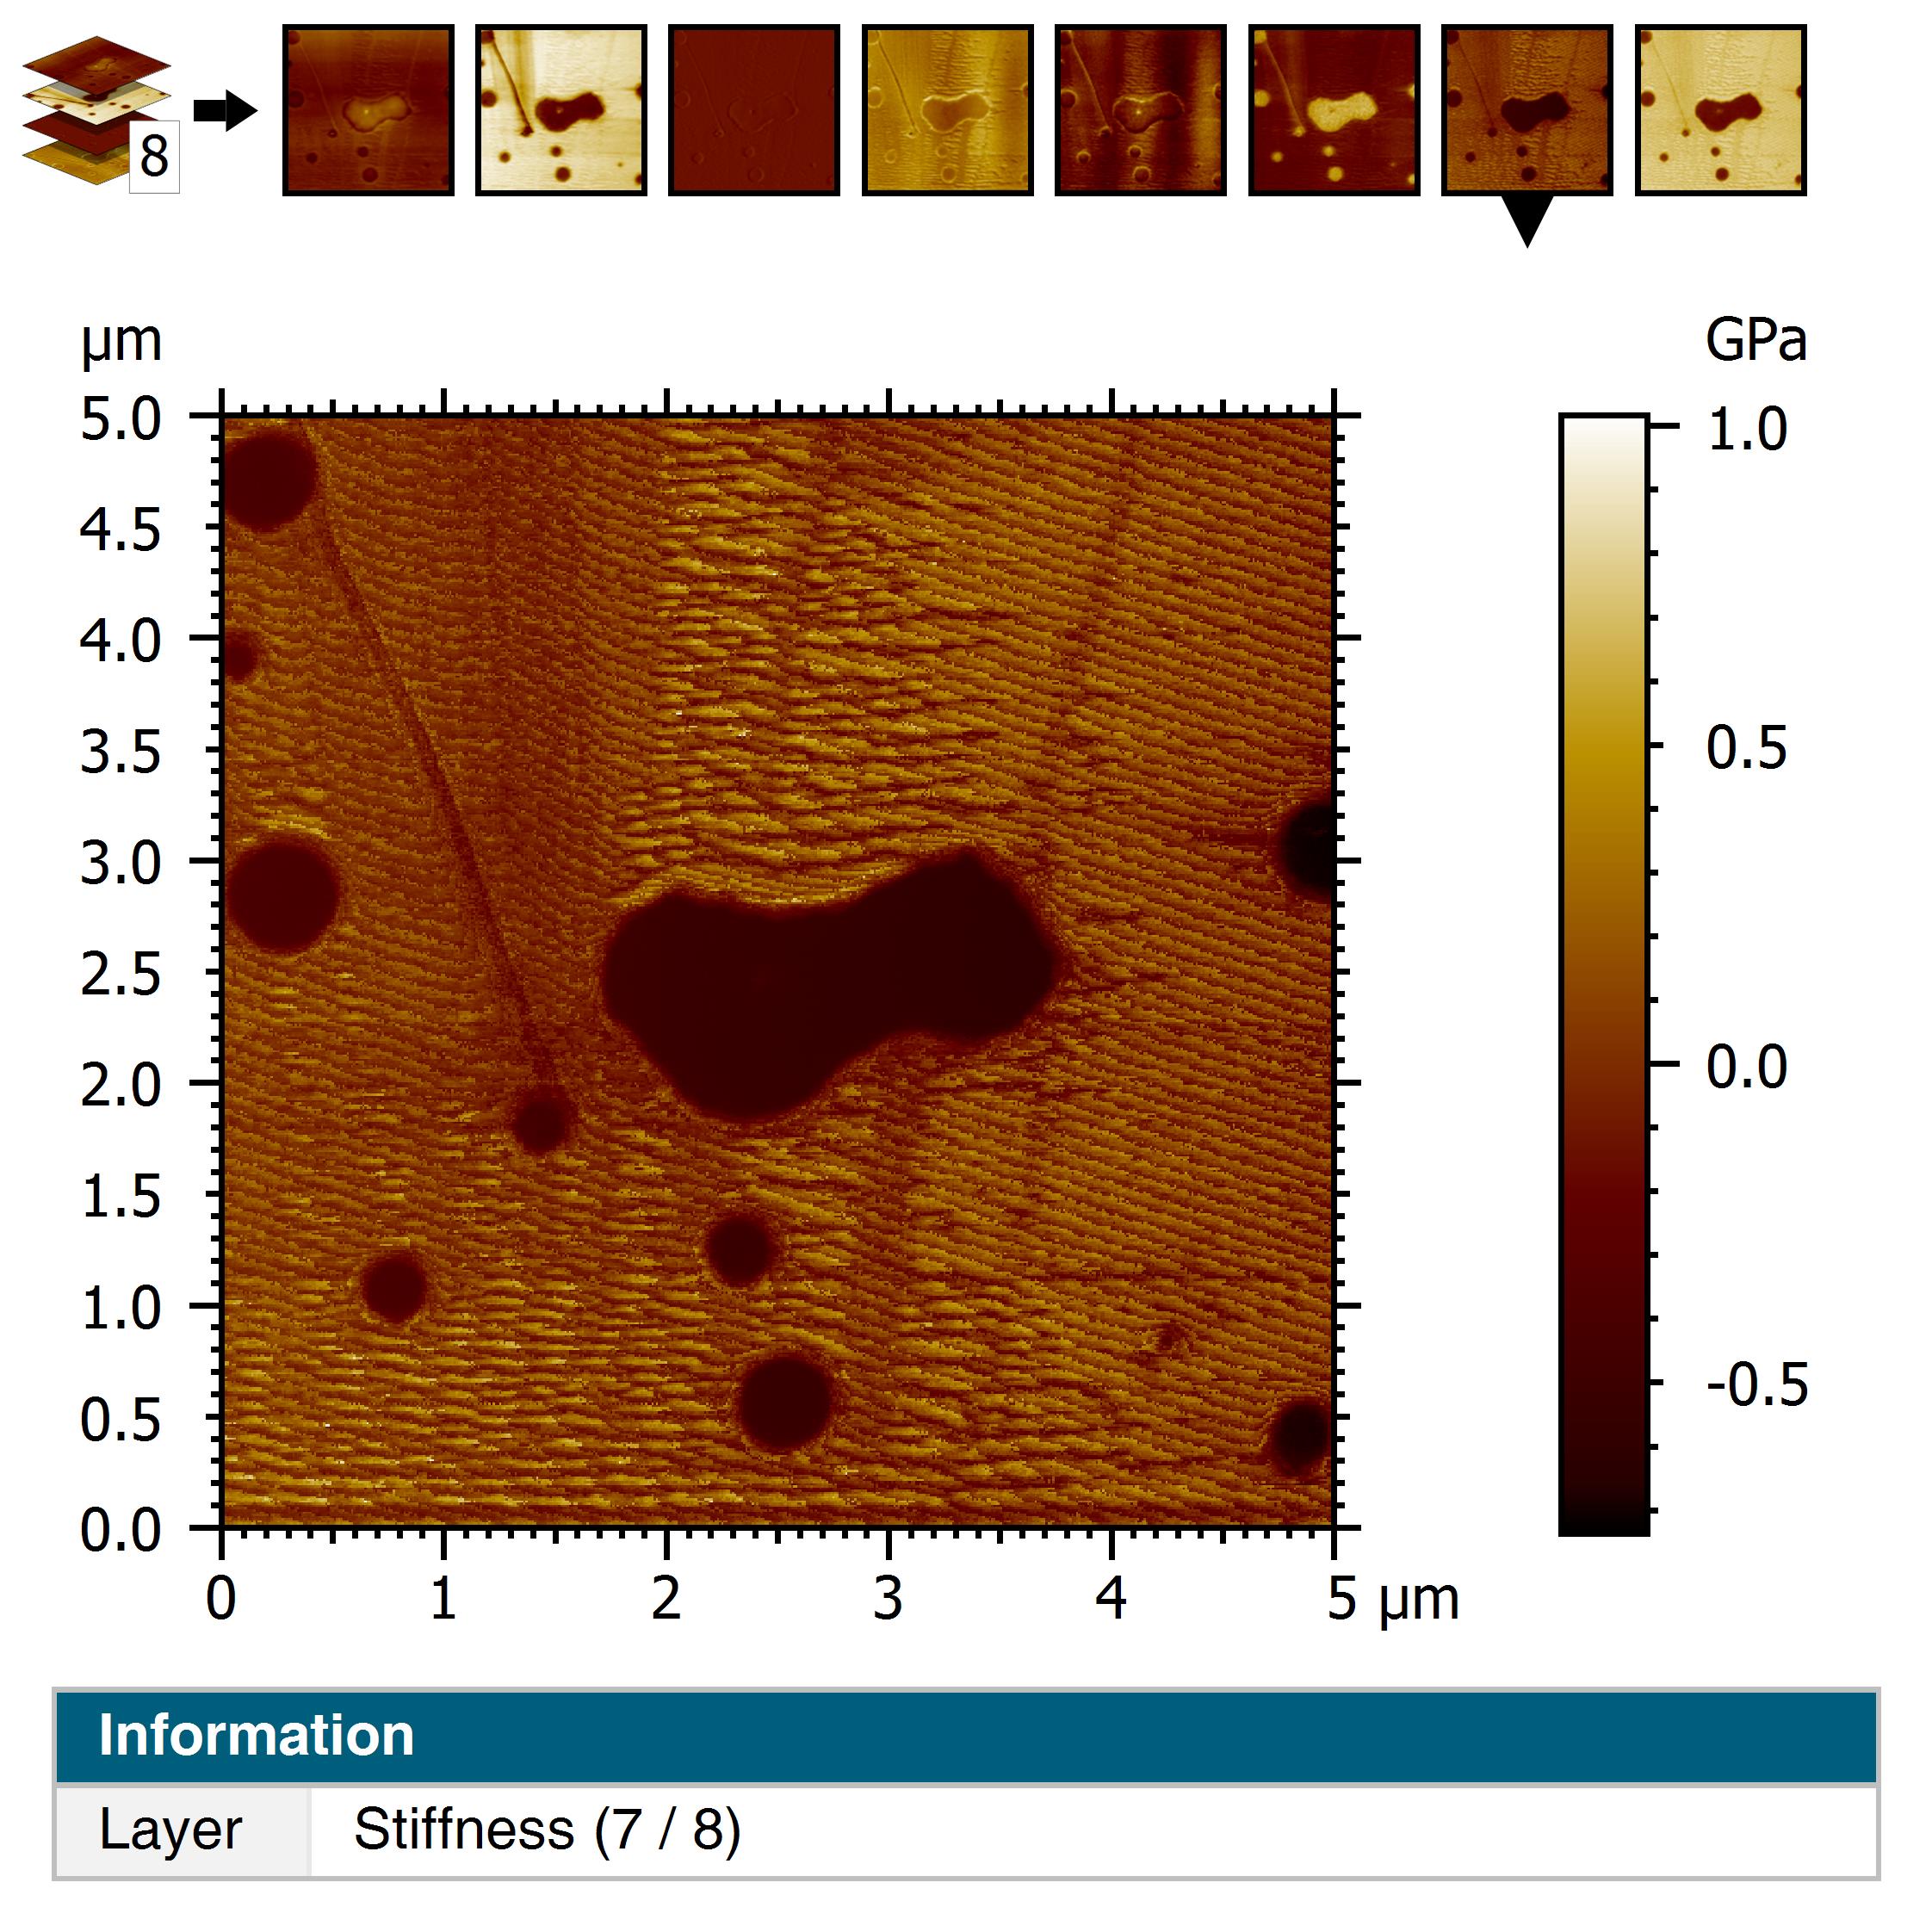
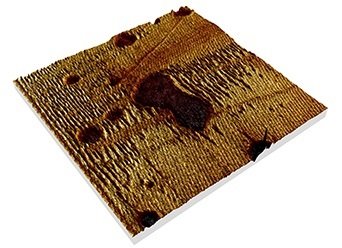
Above (left to right). Height data, stiffness data (displayed in 2D) & 3D overlay of stiffness on height.
FINDING & VISUALIZING CORRELATIONS
Display your data in Full screen mode and select the channel (or “layer”) you wish to visualize using the thumbnails at the top of the frame or the arrows in the contextual ribbon. Alternating the display of different channels is the first step in allowing you to visually identify correlations.
You may display correlations in 3D by superimposing the texture of a layer (in the example above, the stiffness) on a topography layer (the height). In MountainsSPIP®, you can apply color palettes to your data and optimize them to get better contrast. The “SPIP” palette corresponds to colors normally used when studying SPM data but you can choose from a range of many others.
DYNAMICALLY ANALYZING REGIONS OF INTEREST
Using the Extract area operator, you can select a region of interest that will be effective on all channels simultaneously. You can freely move the selection rectangle about, all further dependent (multi-channel) analysis steps will be updated accordingly in real time.
EXPLORE CORRELATION IN GREATER DETAIL
The Extract profile operator lets you display the signal of the different channels on the same graph, and explore correlation in more detail. Below, we display the correlation graph between height (in blue) and dissipation (in gray). Once again, you can freely move the line representing the profile extraction (dotted line) and the graph will be updated automatically.
Above. The Extract profile tool lets users display correlations between different channels (here, height compared to dissipation).
QUANTIFY CORRELATIONS
Finally, correlations between two different channels can be calculated, for example using a point by point ratio and analyzing the mean and distribution of this ratio. This is possible with the Mathematical function operator (see below).
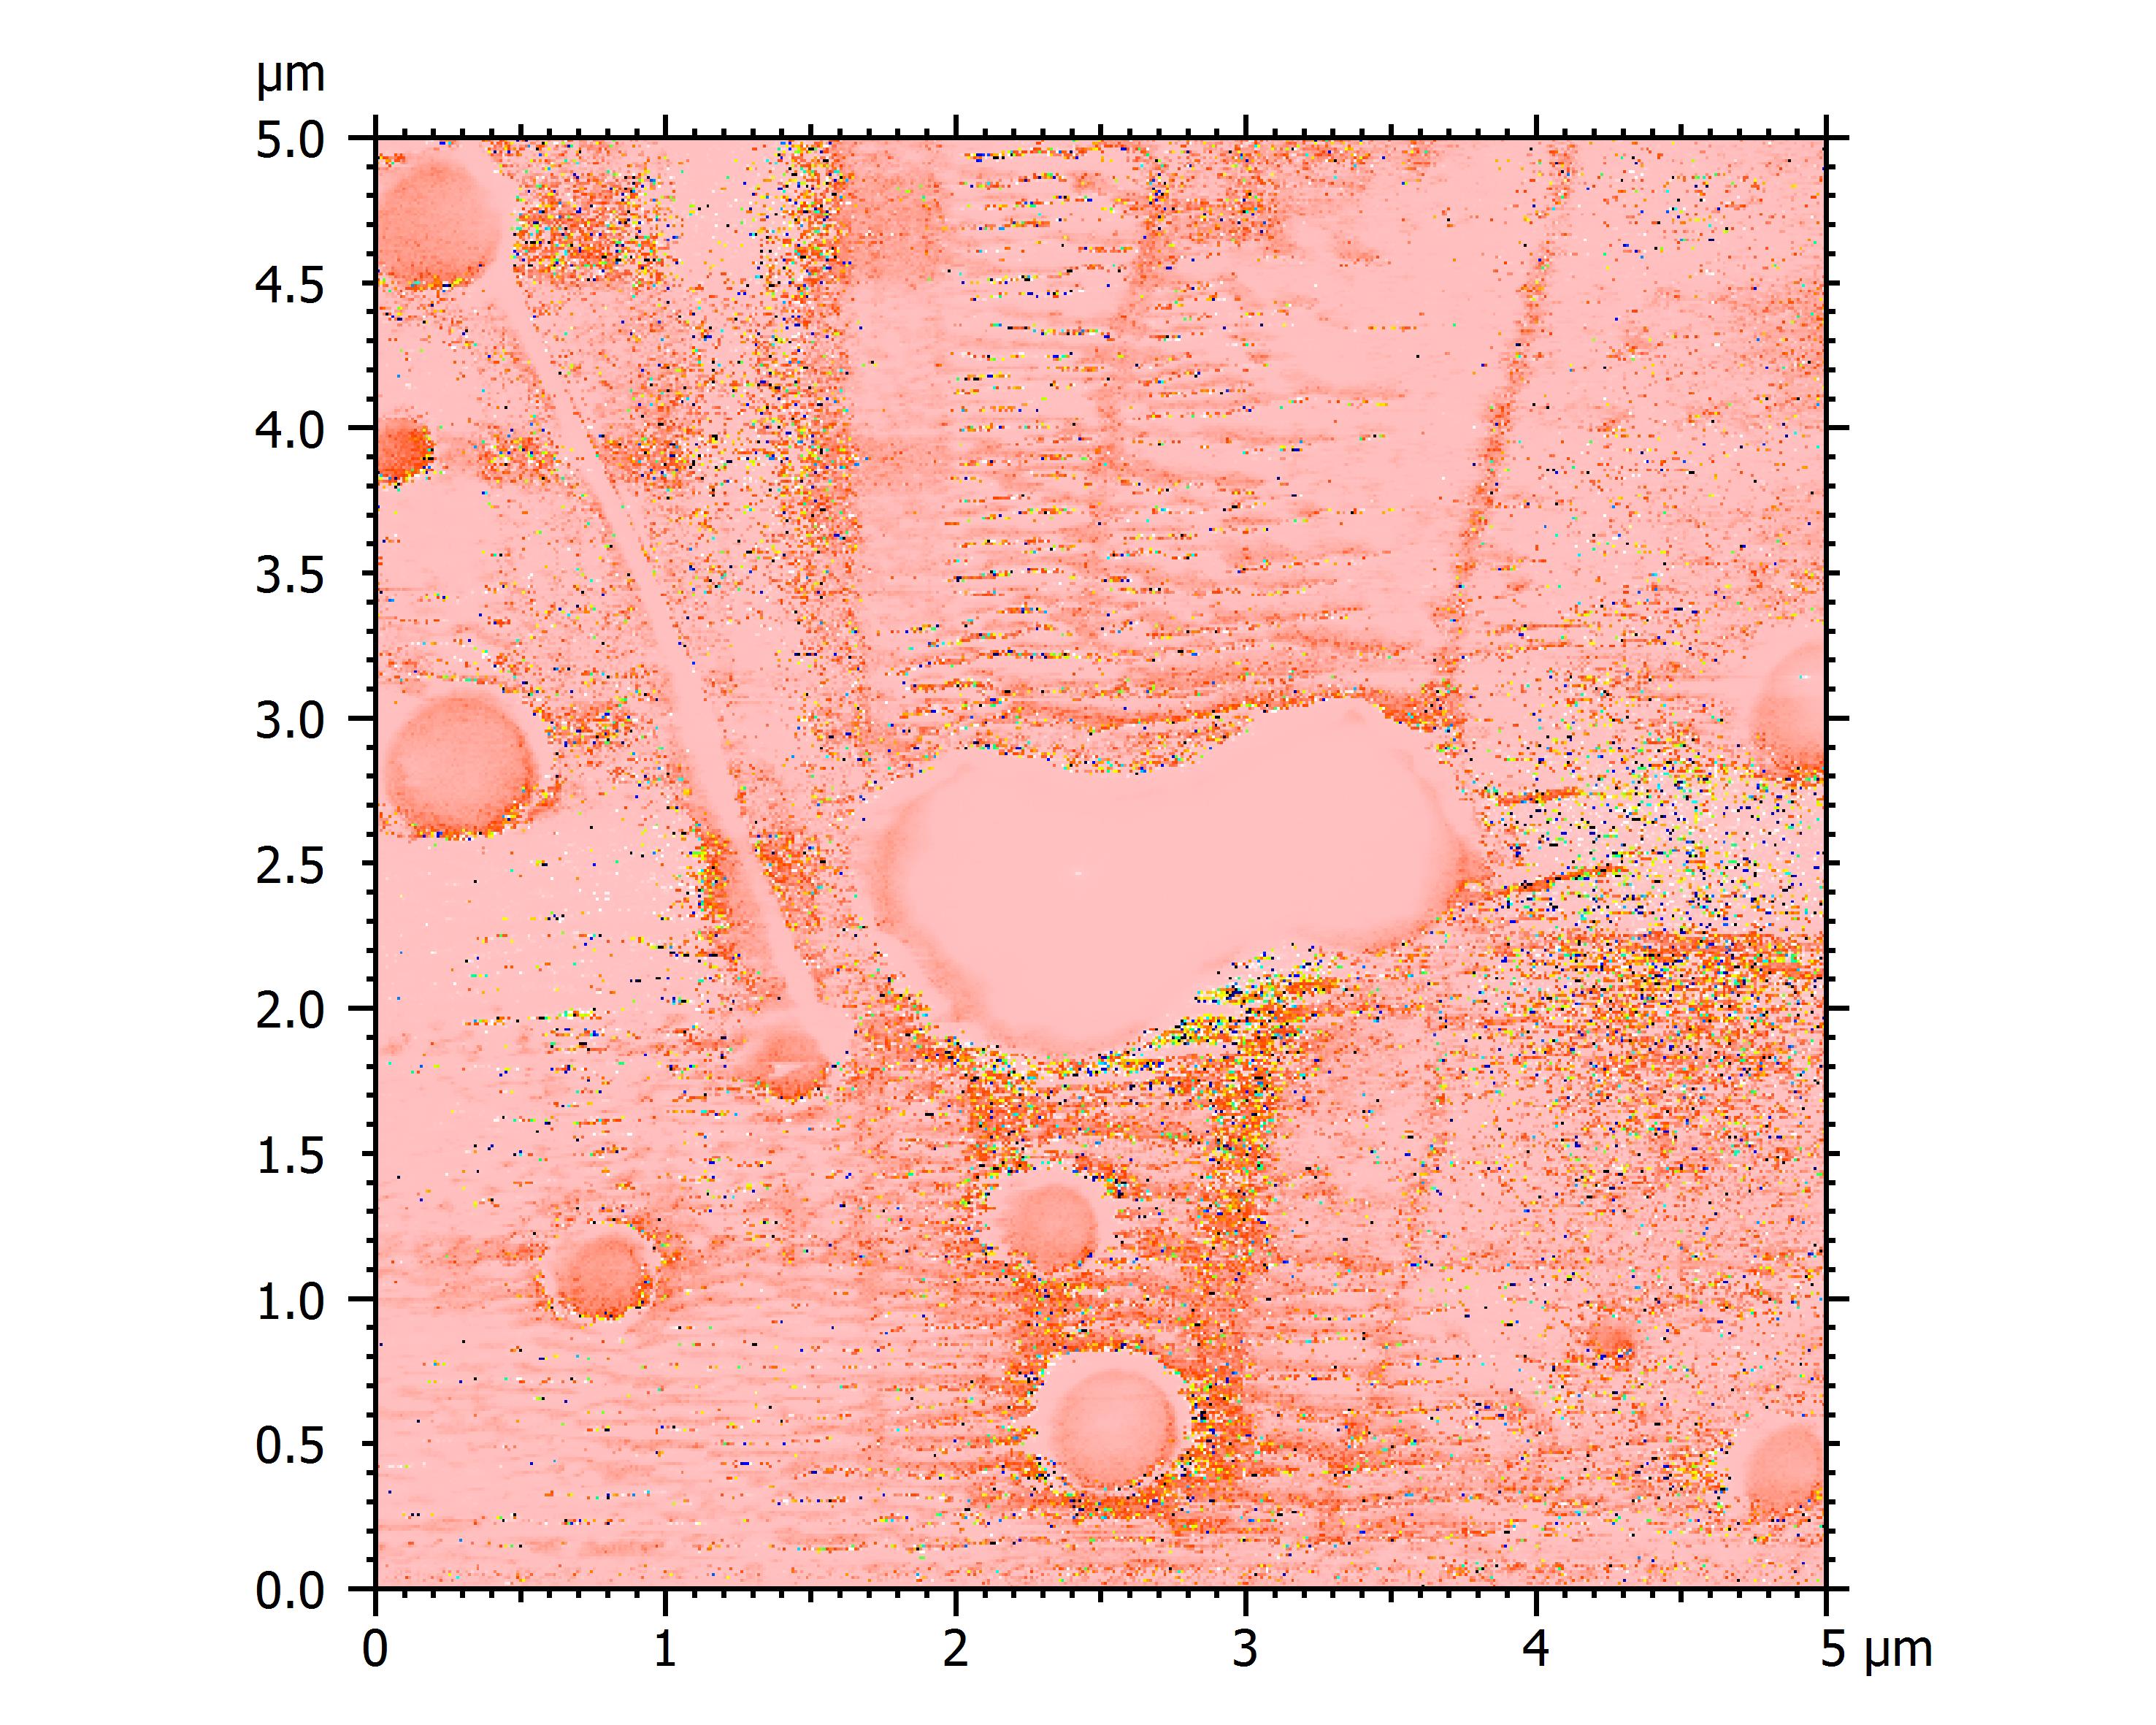
Above. f(m)=Height/dissipation
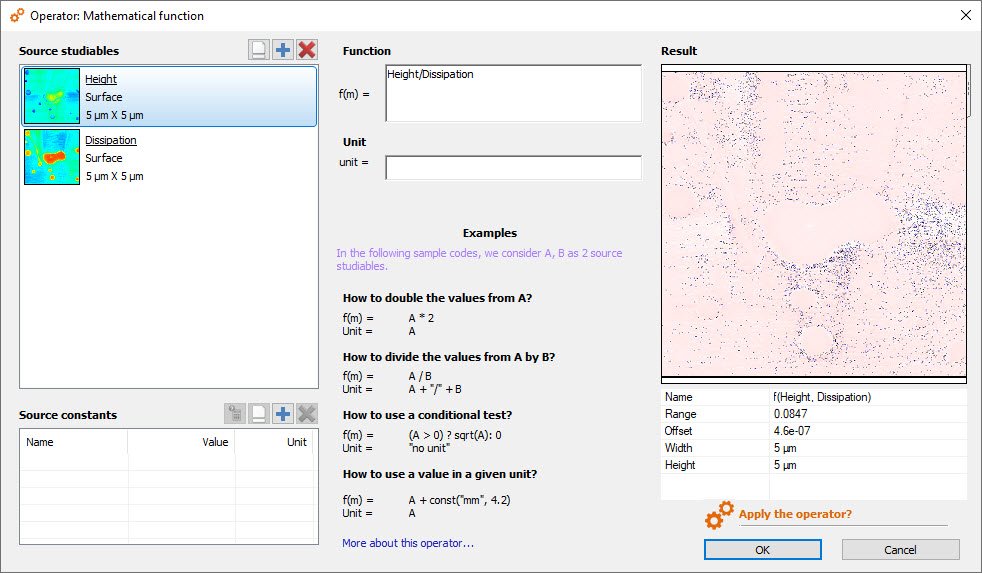
Above. Mathematical function
BUT WHAT IF I ONLY WANT TO STUDY ONE CHANNEL?
All the signals contained in SPM data are not always useful. If you prefer to open only one channel, go to the File explorer, select your file and click on Expand (see image below).
Now, you just have to double click, or drag and drop, the channel(s) you want to analyze.
Other articles you might be interested in
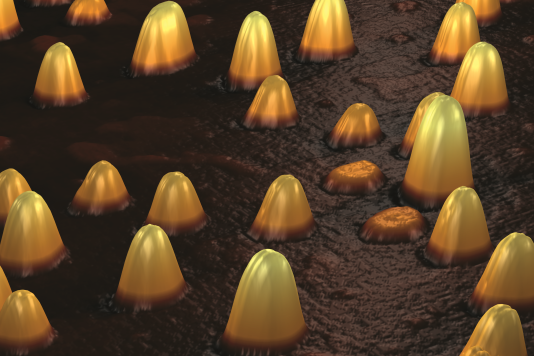
Perform Particle Analysis on microscopy images
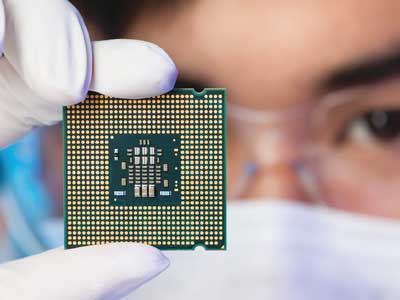
Semiconductors: characterizing 3D structures at the nanoscale
SPIP is now MountainsSPIP® 8
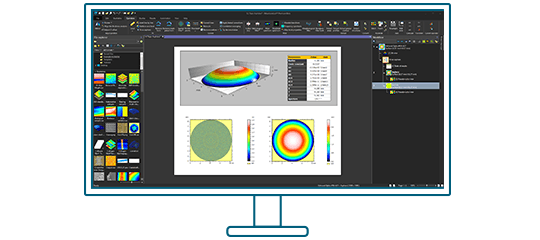
Ready to try for yourself?
Try Mountains® surface analysis software for free