One of the most common questions we receive from Mountains® users is: what cut-off value should I select to filter my data? The bad news is that there is no single answer. The good news is that our senior surface metrology expert, François Blateyron, has a few tips to help you make the right choice.

There are several strategies to consider when choosing the right cut-off and it usually depends on your application. When referring to cut-offs, users usually mean the main cut-off that is used to separate roughness and waviness, but it’s important to be aware of other cut-offs that define the bandwidth of the profile or surface under investigation.
In recent standards, these are referred to as: Nis (microroughness nesting index), Nic (main nesting index) or Nif (form removal nesting index). The term nesting index is an extension of the concept of cut-off, but for most standard filters (Gaussian, Spline, Robust) it is perfectly correct to use the term “cut-off”.
See also:
guide.digitalsurf.revelateur.fr/en/guide-filtration-techniques.html
Cut-off value derived from specification
This is the simplest case, all you need to do is follow the specification.
If the cut-off is clearly written on the drawing, then just use it. Drawing indications followed ISO 1302 until recently, although this standard has now been replaced by ISO 21920-1:2021. On surfaces, refer to ISO 25178-2:2021.
Read more:
guide.digitalsurf.revelateur.fr/en/guide-indications-iso-1302.html
If the specification does not include the cut-off value and only provides the parameter and its tolerance, you need to refer to the default cut-off. ISO 25178-3:2012 does not specify a default cut-off and only recommends that its value should be taken from a series of common values: 0.25 mm; 0.5 mm; 0.8 mm; 1.0 mm etc. However, it is frequent practice to set the default cut-off Nic to 0.8 mm and the default cut-off Nis to 0.0025 mm.
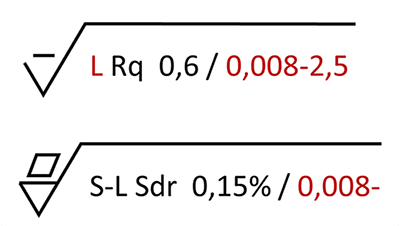
Top. A profile specification with two non-default cut-off values, Nis = 8 µm and Nic = 2.5 mm.
Bottom. An areal specification with one non-default cut-off, Nis = 8 µm, and one default cut-off, Nic = 0.8 mm (omitted).
For profiles, ISO 21920-3:2021 introduces the concept of setting class as a shortcut to a set of default values. The aim is to replace the former procedure described in ISO 4288:1996 which had two drawbacks. Firstly, different procedures were applicable to periodic and non-periodic profiles, leaving the user with a difficult choice when the profile was partially periodic. Secondly, the procedure was made for Verification while it should only refer to Specification. The new concept should correct these two problems. However it is a complex machine and in 80% of practical cases on mechanical components, it leads to the value of Nic = 0.8 mm. The biggest problem is that using a vertical tolerance to define a lateral cut-off value makes very little sense!
See also:
guide.digitalsurf.revelateur.fr/en/guide-lambdas-filter.html
guide.digitalsurf.revelateur.fr/en/guide-default-specifications.html
Cut-off value chosen from spectrum content
Many users do not have drawings at their disposal since they work in non-mechanical fields (materials research, archeology, etc.). They just want to investigate surface texture and put some numbers on it in order to compare it with other samples.
The main goal of filtration is to align asperities on a reference line (or plane) in order to average heights that are consistent with each other (most parameters are based on integration, i.e. on averaging heights). This is why, for roughness parameters, waviness is filtered out (R=P–W). As a result, peaks and valleys are correctly distributed above and below a reference.
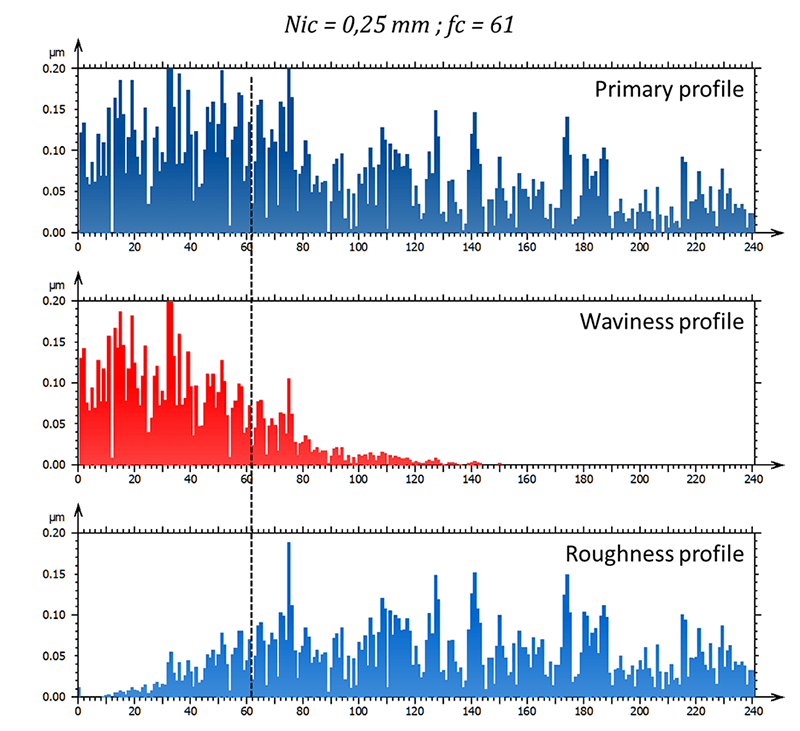
Waviness is formed by the longest wavelengths which are visible in the center of a spectral analysis image (for surfaces) or at the left of the Frequency spectrum graph. On a flat sample without any visible waviness, the filtration will have little effect if any, as frequencies that are supposed to be attenuated already have an amplitude close to zero. So, filtration may be optional in this case. This can be checked using a Spectrum analysis study.
Cut-off assessed by the scale content
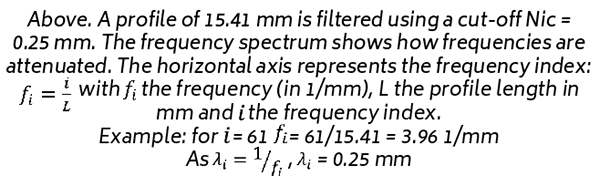
The Scale-Sensitive Fractal Analysis study generates a log-log graph of relative-area (or relative-length) in function of lateral scale. Amongst the available parameters, the Smooth-Rough crossover (SRC) suggests a scale value that is supposed to separate waviness (smooth content) from roughness. It may be used to define the filtration cut-off, but caution must be applied as SSFA works using an upper envelope while filtration is on the mean line. That’s the difference between the E-system (envelope) and the M-system (mean line); the two are not totally correlated.
Above. The SRC value calculated by SSFA is 1.3 mm. When used as the cut-off value, it shows a sound separation between waviness (top right) and roughness (bottom right).
See also:
guide.digitalsurf.revelateur.fr/en/guide-fractal-analysis.html
wwww.digitalsurf.revelateur.fr/optional-modules/scale-sensitive-fractal-analysis
Cut-off value assessed by functional correlation
Normally, the analysis protocol, including filtration conditions, should be established after functional correlation which proves that tracking a given parameter, in given filtration conditions, is equivalent to tracking performance on a workpiece (e.g. resistance to wear, adhesion performance, etc.) This requires application-specific knowledge that cannot be delivered by standards. Metrologists must analyze multiple measurements made on multiple workpieces with different performances, then carry out statistical analysis to demonstrate the significant link between the given performance and the selected parameter.
This analysis can be done by using a bandpass filter to generate a series of surfaces (or profiles) and calculate parameters on each surface, prior to statistical analysis.
See also:
Functional correlation by C. Brown: link.springer.com/referenceworkentry/10.1007/978-3-642-20617-7_16692
guide.digitalsurf.revelateur.fr/en/guide-bandpass-filters.html
Author : François Blateyron
Resources :
Surface Metrology Guide: guide.digitalsurf.revelateur.fr/en/guide-metrology-standards.html