Version 9 of the Mountains® software platform sees the introduction of support for several new data types, including multi-channel cubes. Christophe Mignot, Digital Surf CEO, explains the nature of this new kind of “studiable” and highlights the main applications and advantages for users.

From 1D TO 3D (cubes)
The first software program created by Digital Surf back in 1990 was called “DigiProfil”; it enabled the study of profiles, i.e. a variation along one axis, z = f (x).
Shortly afterwards, in 1991, the company also launched software for analyzing surface topography and became one of the pioneers in this field. A second dimension was thus added: z = f (x, y)
The two software programs were merged in 1996 and the Mountains® platform was born. A countless number of variations have since been released to cover a large number of applications, from profilometry to microscopy. The next step was inevitable. Instrument manufacturers and users who have multi-instrument analysis laboratories require versatile platforms, in order to switch easily from one type of data to another.
Mountains® 9 therefore adds a 3rd dimension making it possible to open, visualize and study tomographic data, where i = f (x, y, z).
Why “multi-channel”?
Nanometric objects and organisms are nowadays called upon to perform increasingly technical and intelligent functions in life sciences, mechanics, microelectronics etc. These functions must be observed and characterized. A basic description of relief (topography) is no longer sufficient: we must be able to map the chemical composition of a surface and study its local physical properties.
Used by thousands of engineers and metrologists worldwide for analyzing topography, Mountains® has also become over the years a powerful tool for correlative microscopy. The software can manage “multi-channel” (or “multi-layer”) images, i.e. those made up of several physical signals. Associating a fluorescence image, conductivity or chemical composition of a sample with a 3D topographic map has become a routine operation.
This “multi-channel” ability applies regardless of dimension: extract a vertical section from a multi-channel image i1,i2, …, iN = f (x, y), and you’ll obtain a multi-channel profile i1,i2, …, iN = f (x).
Now Mountains® allows processing not only of mono-channel cubes, corresponding to the tomographic density of a single material i = f (x, y, z), but also multi-channel cubes enabling the simultaneous observation and quantification of the density of N mixed materials i1,i2, …, iN = f (x, y, z).
From spectrometer to hyperspectral cube
A multi-channel cube is initially obtained from the measurement of a complete spectrum for each voxel. Each horizontal section of a tomographic cube is considered a hyperspectral image.
From hyperspectral cube to multi-channel cube
However, even if certain instruments such as confocal Raman adequately measure one spectrum per voxel, storing a complete spectrum for each voxel is not very realistic.
Instead, it is possible to compare this spectrum (as early as possible in the process) with the N reference spectra of the N known materials, the density of which we wish to map in the cube, and retain only the result.
The information is thus reduced to N intensity cubes, one per material analyzed. In other words we consider that we have N channels for each voxel: i1,i2, …, iN = f (x, y, z).
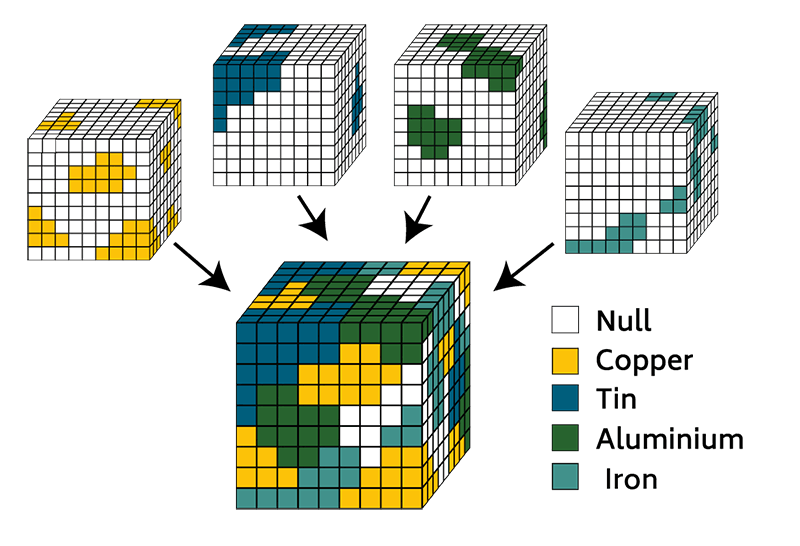
Above. Segmentation of a multi-channel cube: for each voxel, the main element (or zero) is retained.
From mixed cube to segmented cube
Each voxel therefore represents the intensity (or abundance) of several mixed materials. The simplest way to represent this mixture is to assign one color per material and display the mixture of colors thus formed (for example a green channel and a red channel mixed together will give a large number of shades from red to green as an indication of the proportion of each material).
Since the density of a material can vary continuously from zero (no material at all) to a maximum value, there is not always a notion of border between matter and void. However, to make the study of material distribution easier, we may want to segment the cube, in other words artificially make such a border appear between the presence and absence of a material. We can then create grains of material whose number, size, shape, position, density etc. can be studied.
Segmentation consists in choosing, for each voxel, the principal material number and in ignoring the others at one particular point. A significance threshold must be defined below which the density of a material is considered to be zero. And if the intensity of all materials is below the threshold, the voxel is deemed empty. Each voxel in the cube will only represent either a given material or the void (material number or zero).
The 3D visualization tool provided in Mountains® 9 makes it possible to blend these two approaches: “mixed” representation and segmented representation. Animations allowing clear visualization of the distribution of each material in the cube can be generated.
The specific case of FIB-SEM
In FIB-SEM (focused ion beam scanning electron microscopy) the ion beam cuts through the sample, layer by layer, while the electron beam compositionally images each layer. EDX/EDS analysis will yield a multi-channel cube as described above. On the other hand, use of a FIB-SEM in BSE mode is different. Backscattered electron images give us the atomic number of materials observed in the cross section: the larger the nuclei, the more electrons are returned and the lighter the pixels are in the image. We can thus build single channel cubes (each voxel contains a gray level). The representation in “mixed” mode shows these gray levels. Each gray level range is representative of a material; the cube can be segmented by designating grayscale ranges and assigning them to a material using a thresholding tool. Once the cube is segmented, it behaves like a multi-channel cube (like EDX).
With multi-channel cubes, Mountains® users can now analyze materials in all dimensions. It’s also easier to switch from one type of data to another, with numerous visualization and analysis tools available for each type.
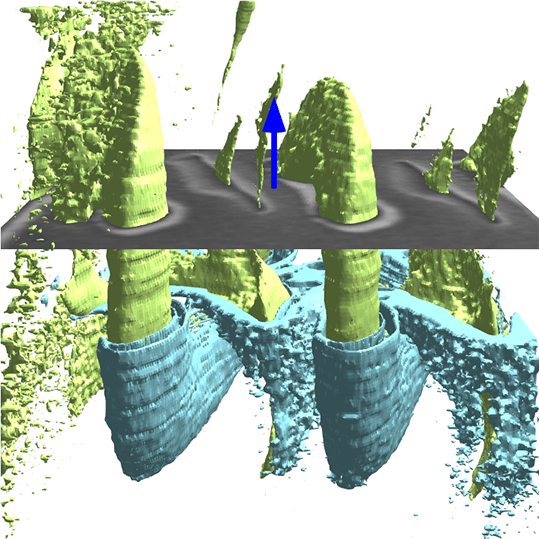
Above. FIB-SEM series of a helical structure loaded as a multi-channel cube in Mountains® 9.
Author : Christophe Mignot